The potential environmental impacts of EU
immigration policy: future population numbers, greenhouse gas emissions and
biodiversity preservation
First online: 3 December 2019
Philip
Cafaro and Frank Götmark
Philip
Cafaro is Professor of Philosophy at Colorado State University. His work
centers on population and consumption issues and on the preservation of wild
nature. Cafaro is co-editor of Life
on the Brink: Environmentalists Confront Overpopulation and author of How Many Is Too Many? The
Progressive Argument for Reducing Immigration into the United States.
philip.cafaro@colostate.edu
Frank
Götmark is Professor of Animal Ecology and Conservation Biology at the
University of Gothenburg. His research interests include population and human
ecology, and the ecology of oak forests. He is the author of numerous articles
on the ecological functioning, scientific management and conservation of
temperate forest ecosystems. Along with Cafaro he is co-Principal Investigator
of The Overpopulation Project.
frank.gotmark@bioenv.gu.se
–––––––––––––––––––––––––––––––––––––––––––
DOI: 10.3197/jps.2019.4.1.71
Licensing: This article is Open Access (CC BY 4.0).
How to Cite:
Cafaro, P., and F. Götmark. 2016. 'The potential environmental impacts of EU immigration policy: future population numbers, greenhouse gas emissions and biodiversity preservation'. The Journal of Population and Sustainability 4(1): 71–101.
https://doi.org/10.3197/jps.2019.4.1.71
–––––––––––––––––––––––––––––––––––––––––––
Abstract
This
article clarifies the potential environmental impacts of more or less expansive
EU immigration policies. First, we project the demographic impacts of different
immigration policy scenarios on future population numbers, finding that
relatively small annual differences in immigration levels lead to large
differences in future population numbers, both nationally and region-wide.
Second, we analyze the potential impacts of future population numbers on two
key environmental goals: reducing the EU’s greenhouse gas emissions and
preserving its biodiversity. We find that in both cases, smaller populations
make success in these endeavors more likely—though only in conjunction with
comprehensive policy changes which lock in the environmental benefits of
smaller populations. Reducing immigration in order to stabilize or reduce populations
thus can help EU nations create ecologically sustainable societies, while
increasing immigration will tend to move them further away from this goal.
Keywords:
immigration; population; European Union; carbon emissions; biodiversity
protection
Acknowledgements: The
authors thank the Department of Philosophy, Colorado State University, the
Department of Biological and Environmental Sciences, Göteborg University, and
the Global Challenges Foundation, Stockholm, for their generous support.
1 Introduction: an implicit
assumption
According
to recent demographic projections (Lutz et al., 2019; United Nations, 2019),
immigration levels will make a substantial difference in the size of future EU
populations. Since population size is one of the fundamental parameters
determining the human impact on the environment (Millennium Ecosystem
Assessment, 2005; IPCC, 2014), this would appear to raise the question of how
EU immigration policy choices could impact future environmental protection
efforts. Yet surprisingly, this question rarely gets asked by
environmentalists, or influences EU policy-makers. The following evidence
illustrates the typical failure to consider this issue.
In
the run up to elections to the European Parliament in May, 2019, the coalition
of European Green parties put forth a statement of principles and political
goals, “Priorities for 2019” (European Greens, 2019a). It was organized around
twelve key goals, starting with fighting climate change—“the defining challenge
of our times”—by phasing out all coal use by 2030, promoting energy efficiency,
and moving quickly to 100% renewable energy sources. It continues with
commitments to boost trains at the expense of (more polluting) air travel,
reducing air and water pollution within the EU, and eliminating non-recyclable
plastics. “To preserve our valuable nature,” Greens advocate that nations
“expand protected natural areas significantly so that they cover key
ecosystems.” They also seek to reorient EU agricultural policy, by “producing
good local, GMO and pesticide-free food” and “farming without cruelty to
animals.”
Curbing
population growth, however, was not one of these twelve key environmental
goals, or even a subsidiary goal. Neither in “Priorities for 2019,” nor in the
related “Manifesto 2019,” nor in a more elaborate list of policy positions on
its website, did the EU Green coalition affirm the need to limit, end, or
reverse population growth—either as a stand-alone policy goal, or as necessary
to any of the environmental goals it did endorse (European Greens, 2019a, 2019b).
In discussing the means to decrease carbon emissions, increase protected areas,
or achieve any other environmental goals, limiting population was not
mentioned.
Immigration
policy was discussed in these documents, not for any potential role in impacting
future population numbers, but as part of affirming immigrants’ rights and
combatting xenophobia and racism. A core Green goal in “Priorities for 2019”
was to “defend the right to asylum and establish legal and safe channels for
migration,” expressed in language implying that attempts to limit immigration
are immoral (European Greens, 2019a). A related statement on “Human Rights and
Migration” advocated “a more ambitious resettlement and relocation scheme,”
with the clear goal of increasing immigrant numbers and no indication that this
potential increase demands demographic or environmental analysis (European
Greens, 2019c).
Based
on a review of recent policy manifestos from several national Green parties,
these coalition statements appear to accurately represent the national parties’
own positions on population matters (see, for example, statements from the UK’s
Green Party (2003, 2017) on population and migration). Based on these
documents, the EU’s Green parties appear to make the following implicit assumption: Population size and immigration
rates have
no important roles to play in the efforts of EU nations to meet their
environmental challenges and create ecologically sustainable societies.
To be
clear, neither EU Green parties nor the coalition affirm such a position
explicitly. However, they act as if this assumption is true by proposing
immigration policies that could greatly increase future EU population sizes,
while simultaneously endorsing a number of very ambitious environmental goals.
We could find no evidence that any of these parties praise Europe’s sustained
low fertility trends, which suggests that they see no environmental value in
the smaller populations to which they could lead. Some, such as Austria’s Green
party, argue for more immigration for conventional economic reasons (Die
Grünen, 2017), which implies that they see little environmental disvalue in
higher populations or increased economic activity. All this indicates that
European Greens assume that the implicit assumption is correct.
In a
similar manner, the chief European Commission documents setting out current EU
policy goals for greenhouse gas emission reductions (European Commission,
2018), biodiversity preservation (European Commission, 2011a, 2015), and
general environmental sustainability (European Commission, 2011b; European
Parliament, 2013) are all equally silent regarding any connection between
future population numbers and achieving ambitious environmental goals. Like the
EU’s Green parties, the EU itself has not formulated a population policy. It
does have an immigration policy, or rather a complex suite of policies, which
are contentious and in flux (European Commission, 2011c, 2019). But these
policies make little reference to immigration’s potential impact on population
numbers, beyond recurring statements that immigration will help support
workers’ pensions in the future (European Commission, 2011c, 2014). This
suggests that belief in “the implicit assumption” extends more widely to
agencies and policy-makers across the political spectrum.
In
response, this paper makes the implicit assumption explicit and attempts to
test it against reality. Section two explores the potential demographic impacts
of immigration on future EU population numbers. Sections three and four consider
the potential impacts of human numbers on EU greenhouse gas emissions and on
possibilities for biodiversity conservation in Europe. Section five concludes
that the implicit assumption is false and that immigration policy should be
made in recognition of its environmental effects.
2 Impacts of immigration on
future population numbers
Europe
is the first continent to end the population explosion that has characterized
humanity’s recent demographic trajectory. This is largely a function of
sustained below-replacement fertility levels over the past two generations,
with strong indications that they are likely to continue (Balbo et al., 2013).
Recent projections out to 2100 predict relatively slow population growth across
much of western and northern Europe and more or less sharply decreasing
populations among eastern and southern European nations (Lutz et al., 2019;
United Nations, 2019). However, such baseline projections mask wide uncertainty
and future numbers will vary depending on actual fertility, mortality,
immigration, and emigration rates. Demographers tend to agree that immigration
trends have the greatest potential to influence future EU population numbers
(Azose et al., 2016). This is because increases in longevity will remain
popular and uncontroversial goals for future political leaders; because
immigration numbers can be raised or lowered much more quickly than fertility
rates through direct policy choices; and because there is growing pressure for
increased immigration coming from rapidly growing countries in Africa and the
Middle East (United Nations, 2019).
In an
effort to understand the potential impact of immigration, family support and
economic safety net policies on future population numbers, the authors and
colleagues recently developed new policy-based EU population projections out to
2100 (Cafaro and Dérer, 2019). The sheer range of immigration policies
advocated by European political parties is impressive and we sought to capture
this range in our projections. For western European nations and the EU as a
whole, five different immigration scenarios were considered, built around
multiples of the average annual net immigration for the past twenty years,
which we labelled “status quo.” These scenarios were zero net migration, ½
status quo annual net migration, status quo net migration, 2X status quo net
migration, and 4X status quo net migration. This last scenario represents a
rough proxy for an “open borders” policy, which is difficult to model. These
broad migration scenarios capture the range of policy choices advocated across
the EU today, from drastically curtailing immigration to greatly expanding it,
with the three middle alternatives (½ to 2X the status quo) covering the most
likely range of alternatives (see Cafaro and Dérer, 2019, for methodological
details). For a full range of population projections for all EU nations and the
EU as a whole, please see the website of The Overpopulation Project.
Consider
first our projections for the European Union as a whole. The current 28 countries
in the EU had a combined population in 1950 of 379.8 million and their combined
population in 2016 was 510.3 million.[1] The
region’s current total fertility rate (TFR) is 1.60 and its average annual net
migration level over the past 20 years (1998-2017) was about 1.2 million.
Figure 1 graphs population projections for the EU under our five migration
policy scenarios.
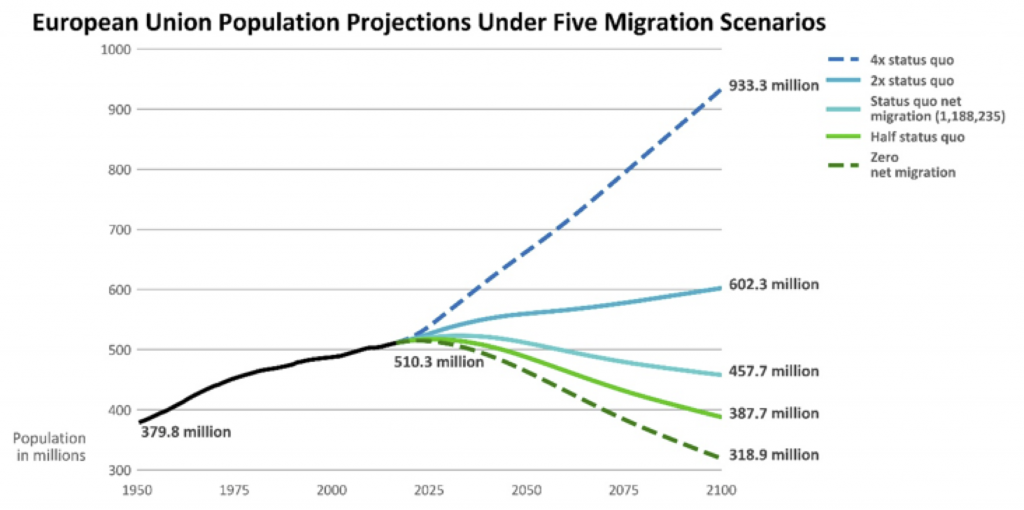
Figure
1. Status quo migration is the continuation of the past 20 years average annual
net migration level (1,188,235). Migration scenarios use total fertility rates
varying between 1.65 and 1.90, with higher immigration levels projected to
drive higher TFRs. Source: Cafaro and Dérer, 2019.
How
might immigration influence future EU population numbers? Continuing the status
quo of about 1.2 million annual net positive migration (along with status quo
family support policies and economic safety net policies, which influence
fertility rates) would lead to a 10% population decrease, or 52.6 million fewer
people in 2100. Cutting net average migration in half would reduce the EU
population by an additional 70 million people, or an extra 14% compared to the
population loss under the status quo scenario, for a total drop of 122.6
million people by 2100 (24%) compared to the current (2016) population.
Doubling net migration, conversely, would switch the EU’s population from
declining by 52.6 million (-10%) under the status quo to growing by 92.0
million (+18%). That’s a difference of 214.6 million people across the most
likely range of immigration policy changes (cutting in half or doubling current
migration rates). The spread across all five policy choices is much greater:
over 600 million people, from swelling to 933.3 million in 2100 (an 83%
increase) in the case of quadrupling status quo net migration numbers, to
contracting to only 318.9 million in 2100 (a 38% decline) by reducing net
migration to zero.
Clearly,
immigration policy changes have the potential to increase or decrease the EU
population by hundreds of millions of people by 2100 (Lutz et al., 2019; Cafaro
and Dérer, 2019). A key take-away is that relatively small annual changes have the potential to cumulate
into large overall changes in the not-too-distant future.
And what is true for the EU as a whole, holds true for its individual nations.
Figure 2 graphs population changes for the five most populous EU nations under our
five immigration scenarios. It shows that by 2100, just three generations from
now, different immigration policies could generate widely different national
population numbers.
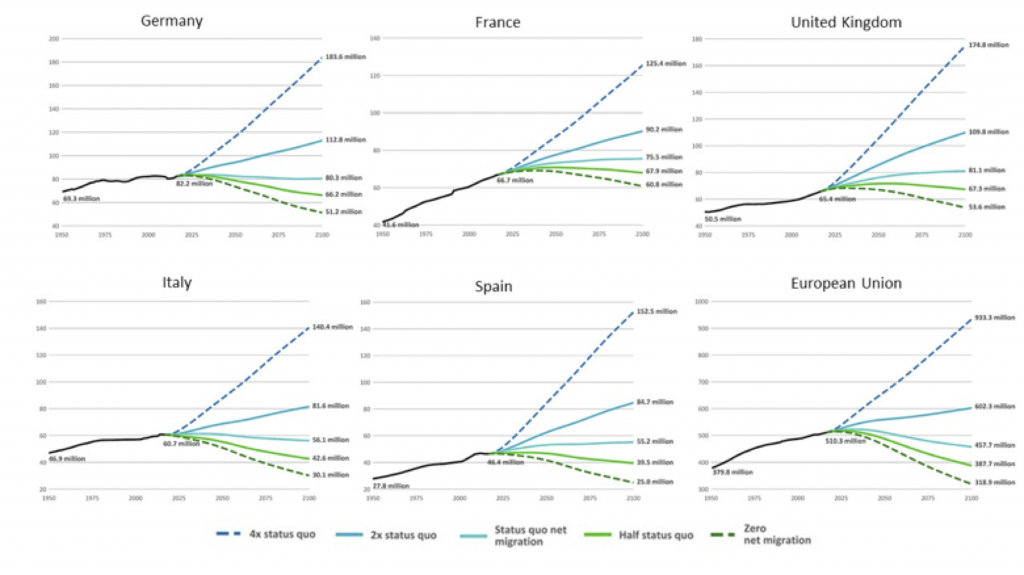
Figure
2. Population projections for the five most populous EU countries and the EU as
a whole under five migration scenarios: zero net migration, ½ status quo
migration, status quo migration, 2X status quo migration, and 4X status quo
migration. Total fertility rates vary, with higher immigration levels projected
to drive higher TFRs. Source: Cafaro and Dérer, 2019.
For
example, annual net migration levels into Germany have averaged a little less
than 260,000 over the past twenty years. Continuing at this level for the rest
of the century would lead to a stable German population, according to our
calculations, while increasing or decreasing annual immigration levels would
lead to populations that were tens of millions higher or lower. Such variations
are possible. Net immigration into Germany has varied widely in recent years,
from – 56,000 in 2008 to 1.2 million in 2015 (Eurostat, 2019), and there is
widespread support both for greatly increasing immigration (Social Democrats
and especially Die
Grünen) and greatly decreasing it (Christian Democratic Union and
especially Alternative für Deutschland).
The three most likely immigration policy scenarios generate a population range
in 2100 of 46.6 million people, while considering the full range of migration
scenarios increases the 2100 population variability to 132.4 million: between
62% and 123% of the current population.
France,
with higher native fertility rates and lower net migration levels, exhibits a
less dramatic demographic range than Germany, while Spain, Italy and the UK
exhibit greater potential demographic volatility. But in every case,
immigration’s potential impacts on future populations are substantial (see
table 1).
Table 1. Status quo annual net
migration numbers (average from 1998-2017) and percentage change from current
population by 2100 under different migration scenarios. Source: Eurostat, 2019;
Cafaro and Dérer, in press.
|
Annual status quo net
migration |
Zero net migration |
½ status quo |
Status quo migration |
2X status quo |
4X status quo |
|
|
European Union |
1,188,235 |
-38% |
-14% |
-10% |
+10% |
+83% |
|
Germany |
259,316 |
-38% |
-19% |
-2% |
+37% |
+123% |
|
France |
100,525 |
-9% |
+2% |
+13% |
+35% |
+88% |
|
United Kingdom |
230,107 |
-18% |
+3% |
+24% |
+68% |
+167% |
|
Italy |
229,093 |
-50% |
-30% |
-8% |
+34% |
+131% |
|
Spain |
270,112 |
-46% |
-15% |
+19% |
+82% |
+228% |
The
key point is that population decrease is not a given for the EU during the
coming century, despite much attention in the media and among economists to
“aging and shrinking populations.” EU fertility rates may remain low compared
to other regions of the world. But immigration policies clearly have the power
to cancel the population decreases to which low fertility rates otherwise would
lead: indirectly, by increasing European fertility rates (Sobotka, 2008; Kulu
et al., 2017; Pailhé, 2017), and more directly, by adding tens of millions more
people and their descendants (Pew Research Center, 2017). However, in most
cases, EU nations appear well placed to stabilize or slowly reduce their
populations, should they choose to do so. But should they? That depends, at
least in part, on whether the implicit assumption is correct, that population
sizes are irrelevant to achieving environmental goals. We turn now to this
question.
3 Impacts of human numbers on
EU greenhouse gas emissions
To
their credit, the EU and its member states have set some of the most ambitious
climate goals in the world. The EU enacted legislation to reduce greenhouse gas
emissions 20% by 2020 compared to 1990 levels, a goal it achieved several years
early. It set a 40% reduction target for 2030 as the union’s “nationally
determined contribution” under the Paris Agreement (European Council, 2014),
subsequently developing a “low-carbon economy roadmap” aiming for 80% to 95%
reductions by 2050. The European Commission recently strengthened these goals,
committing to 55% reductions by 2030 and “zero net emissions” by 2050 (European
Commission, 2018).
In
the past, population growth has been identified along with increased economic
activity as one of two main drivers of increased global CO2 emissions (IPCC, 2007, 2014) and
reducing population growth has been identified as an important potential
mitigation response (O’Neill et al., 2012; Casey and Galor, 2017; Bongaarts and
O’Neill, 2018). A recent study found that regional population growth has
contributed considerably to recent CO2emissions
in Western Europe (Weber and Sciubba, 2018). In contrast, looking forward, the
implicit assumption implies that population size has no important role to play
in the efforts of EU nations or the EU as a whole to meet their carbon
emissions reduction goals. Is this assumption plausible?
We do
not know how successful the nations of the EU will be in decreasing their per
capita carbon emissions by 2050. We analyze the potential impact of population
on this effort by considering three possible per capita emission paths to
determine how different population sizes could impact reduction targets. The
first, pessimistic scenario is a continuation of current (2016) emissions
levels of 8.7 tonnes CO2e (CO2 equivalent).
The second is the “reference scenario” where existing national commitments
reduce annual GHG emissions 48% by 2050 relative to 1990 levels, with per
capita emissions declining to an average of 5.7 tonnes CO2e (Capros et al., 2016). In the most
optimistic scenario, we imagine increased national commitments reducing the
average EU citizen’s per capita emissions to 2.2 tonnes CO2e; 18% of 1990 levels, equivalent to the
GHG emissions of the average UK citizen in 1800.
As
the annual GHG emissions of a nation or region equal its total population
multiplied by their per capita emissions, a simple equation can show how our
five immigration scenarios could intersect with these three per capita
emissions scenarios to determine future emissions. Table 2 shows the different
annual emissions outcomes in 2050. In every case, increased immigration leads
to larger populations, which in turn lead to smaller decreases in total
greenhouse gas emissions, in individual countries and in the EU as a whole. For
example, under the reference scenario, Germany achieves a decrease to 56% of
current emissions levels at zero net migration, but only a decrease to 88% of
current levels when net immigration increases to 4X recent levels. The greater
the decrease in per capita emissions, the smaller the increase in 2050
emissions caused by increased immigration. However, for all per capita
emissions rates, total emissions in 2050 are significantly higher at higher immigration
levels. Thus, at least for this medium-range time frame, the implicit
assumption appears provisionally falsified.
Table 2. Percentage of annual
greenhouse gas emissions in 2050 expressed as a percentage of GHG emissions in
2016, for five EU countries and the EU as a whole. The green shaded scenarios
achieve the minimum decreases needed to stay on track for the “low carbon
economy” target (80% reductions from 1990 levels). Source: own calculations.
|
Zero net migration |
½ status quo |
Status quo |
2X status quo |
4X status quo |
|
|
Per capita emissions remain at
current levels (2016) |
|||||
|
European Union |
90.8% |
95.5% |
100.1% |
109.7% |
129.9% |
|
Germany |
89.5% |
95.7% |
100.5% |
114.8% |
141.7% |
|
France |
102.5% |
105.8% |
109.4% |
115.8% |
130.4% |
|
United Kingdom |
102.4% |
109.4% |
116.3% |
130.8% |
161.0% |
|
Italy |
83.5% |
90.8% |
99.8% |
112.9% |
144.0% |
|
Spain |
89.2% |
100.2% |
113.9% |
133.8% |
180.9% |
|
Per capita emissions decrease as in the
reference scenario |
|||||
|
European Union |
59.5% |
62.5% |
65.6% |
71.8% |
85.0% |
|
Germany |
55.6% |
59.5% |
62.4% |
71.3% |
88.0% |
|
France |
73.6% |
76.0% |
78.6% |
83.2% |
93.7% |
|
United Kingdom |
59.6% |
63.7% |
67.7% |
76.2% |
93.8% |
|
Italy |
56.8% |
61.8% |
67.9% |
76.8% |
98.0% |
|
Spain |
66.2% |
74.4% |
84.6% |
99.4% |
134.4% |
|
Per capita emissions decrease to 2.2 tonnes
CO2e |
|||||
|
European Union |
23.0% |
24.1% |
25.3% |
27.7% |
32.8% |
|
Germany |
17.3% |
18.5% |
19.4% |
22.2% |
27.4% |
|
France |
31.7% |
32.8% |
33.9% |
35.9% |
40.4% |
|
United Kingdom |
28.5% |
30.5% |
32.4% |
36.4% |
44.8% |
|
Italy |
25.5% |
27.7% |
30.5% |
34.5% |
44.0% |
|
Spain |
26.9% |
30.2% |
34.3% |
40.3% |
54.5% |
Notably,
the scenarios that achieve the emissions decreases needed to stay on track for
the “low carbon economy roadmap” (green shaded areas in table 2) combine low
average per capita emissions with relatively low immigration levels. This
suggests that human numbers, average consumption levels, and the technologies
used to accommodate them, all make a substantial difference to total emissions.
By itself, curbing population is not enough to achieve ambitious EU emissions
reduction goals, but clearly it would help. Table 3 illustrates the same point,
calculating what percentage of per capita emissions reductions would be
necessary for the EU’s most populous countries to achieve the minimum target
for the low carbon economy roadmap under different immigration scenarios. As
immigration and thus total population increases, so does the need to decrease
average per capita emissions, leading to the common phenomenon of having to
“run faster just to stand still” and safeguard environmental achievements
(Palmer, 2012).
Table 3. Per capita emissions
reductions required to meet the 2050 minimum goal for the low carbon economy
roadmap, expressed as a percentage reduction compared to per capita emissions
in 2016. Source: own calculations.
|
Zero net migration |
½ status quo |
Status quo |
2X status quo |
4Xstatus quo |
|
|
European Union |
71.6% |
73.0% |
74.3% |
76.5% |
80.2% |
|
Germany |
69.8% |
71.8% |
73.1% |
76.5% |
80.9% |
|
France |
77.2% |
77.9% |
78.7% |
79.8% |
82.1% |
|
United Kingdom |
66.3% |
68.5% |
70.4% |
73.6% |
78.6% |
|
Italy |
69.8% |
72.2% |
74.7% |
77.7% |
82.5% |
|
Spain |
80.7% |
82.9% |
84.9% |
87.2% |
90.5% |
Readers
may wonder why we do not analyze a 100% emissions reduction alternative, which,
after all, is now an official EU policy goal for 2050 (although not an official
policy goal for most EU nations). We do not do so because the goal of “zero net
emissions” is not really the same as reducing average per capita or personal
emissions to zero, which is impossible, at least by 2050. Zero net emissions,
if it is achieved, will instead combine low per capita emissions (generated by
continued food consumption, transport, etc.) with so-called “negative
emissions,” in which as yet untested and unscaled technologies would remove
carbon from the air, water, or soil (European Commission, 2018).[2] Achieving
these negative emissions at the necessary scale is likely to be very expensive,
if it is possible at all, and some of the technologies being considered may be
more dangerous than climate disruption itself (Lenzi et al., 2018). For these
reasons, climate experts agree that it would be best to decrease actual
“positive emissions” quickly and to the greatest extent possible (Van Vuuren et
al., 2018). EU citizens deserve a realistic picture about the contributions
reducing their consumption or population numbers could make in helping them do
their part to limit global climate change.
To
get a fuller picture, let us look further out in time and consider not just
potential GHG emissions at some discrete point in the future, but the cumulative impacts of immigration policies on total emissions during the rest of the
century. After all, many GHG emissions will remain in the atmosphere for a long
time, warming the Earth for the entire time and contributing to ocean
acidification when they eventually cycle back down (IPCC, 2013). The challenge
is to transform our societies as quickly as possible so as to minimize their
GHG emissions over the course of this century.
Consider
how our five immigration scenarios would influence the total reductions
achieved under three plausible emissions reduction scenarios: 50%, 70% and 90%
per capita GHG reductions, each phased in linearly between now and 2100. Taking
80 years to reduce per capita emissions 50% would represent a waning EU
commitment to deal with climate change, with slow renewable electrification and
lifestyle changes, etc.; it is a pessimistic yet possible scenario. 70% per
capita reductions represent a stable to modest increase in current national
commitments, especially taking into account that per capita emissions have not
improved since 2014 for the EU-28 population. 90% per capita reductions can
stand in for an optimistic “total decarbonization” scenario, since as we have
seen, “zero net emissions” is shorthand for low per capita emissions combined
with high-tech efforts to suck carbon out of the environment and safely
sequester it.
Table 4. Cumulative GHG
emissions in gigatons, 2016-2100, for the five most populous EU countries and
the EU as a whole, under three per capita emissions reduction scenarios and
five net migration scenarios. Immigration changes are phased in over 10 years,
per capita emissions reductions are phased in linearly over the course of the
century. Source: own calculations.
|
Zero net migration |
½ status quo |
Status quo |
2X status quo |
4X status quo |
|
|
Per capita emissions decrease 50% by 2100 |
|||||
|
European Union |
243.2 |
258.7 |
274.2 |
306.1 |
376.0 |
|
Germany |
50.7 |
55.1 |
58.7 |
68.5 |
88.1 |
|
France |
29.9 |
31.1 |
32.5 |
34.9 |
40.6 |
|
United Kingdom |
31.9 |
34.6 |
37.4 |
43.0 |
55.3 |
|
Italy |
21.8 |
24.1 |
26.9 |
31.4 |
41.8 |
|
Spain |
17.8 |
20.6 |
23.9 |
29.1 |
41.4 |
|
Per capita emissions decrease 70% by 2100 |
|||||
|
European Union |
213.0 |
225.2 |
237.3 |
262.3 |
316.8 |
|
Germany |
44.6 |
48.1 |
50.8 |
58.6 |
73.9 |
|
France |
21.9 |
22.6 |
23.4 |
24.7 |
27.9 |
|
United Kingdom |
27.8 |
29.9 |
32.1 |
36.5 |
46.1 |
|
Italy |
19.3 |
21.1 |
23.4 |
26.8 |
35.0 |
|
Spain |
15.7 |
17.9 |
20.5 |
24.6 |
34.2 |
|
Per capita emissions decrease 90% by 2100 |
|||||
|
European Union |
183.9 |
192.7 |
201.5 |
219.7 |
259.0 |
|
Germany |
38.5 |
41.0 |
43.0 |
48.7 |
59.7 |
|
France |
21.9 |
22.6 |
23.4 |
24.7 |
27.9 |
|
United Kingdom |
23.7 |
25.3 |
26.8 |
30.0 |
36.9 |
|
Italy |
16.8 |
18.1 |
19.8 |
22.3 |
28.2 |
|
Spain |
13.7 |
15.3 |
17.2 |
20.1 |
27.1 |
Table
4 shows that for every country, higher immigration leads to higher population
numbers, which in turn lead to substantially greater cumulative GHG emissions.
Under the 70% per capita emissions reduction scenario, for example, cumulative
emissions would be 18% less for Germany if they halved net migration compared
to doubling it, and 14% less for the EU as a whole. The impact of immigration
numbers on cumulative emissions decreases with faster per capita emissions
reductions. But even under the optimistic 90% per capita emissions reduction
scenario, the impact of changing immigration levels remains substantial. Figure
3 compares cumulative GHG emissions under various scenario combinations to the
cumulative emissions that would be generated if per capita emissions and net
migration levels remained at current (2016) levels.
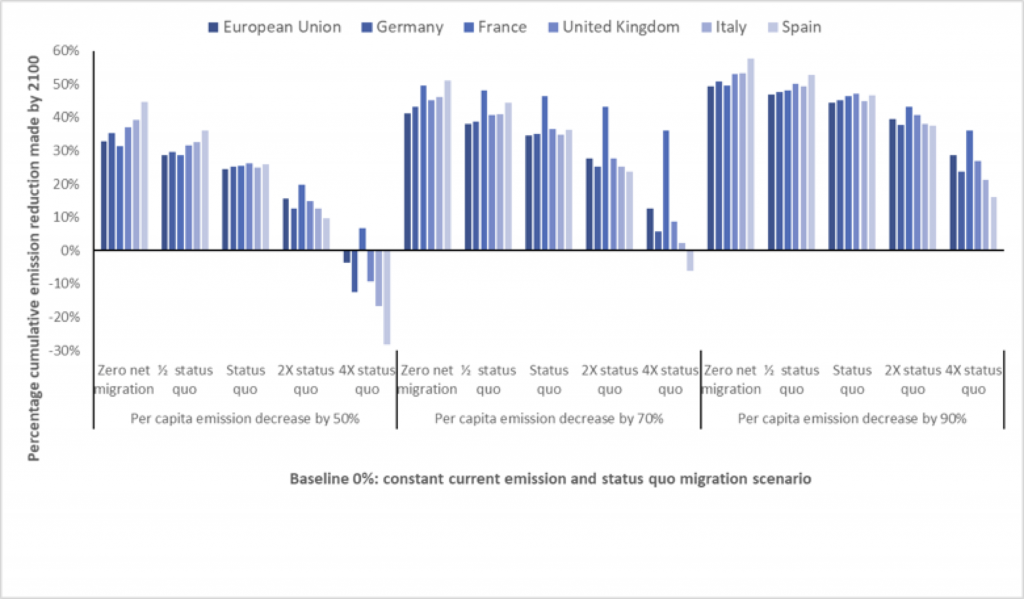
Figure 3.
Percentage emission reductions by 2100, compared with emissions that would be
generated if per capita emissions and net migration levels remained at current
levels. Calculated for the five most populous EU countries and the EU as a
whole, under three per capita emissions reduction scenarios and five net
migration scenarios. Negative percentages indicate cumulative emissions would
be worse than a continuation of current per capita emission and net migration
levels. Source: own calculations.
One
important result is that changes in immigration levels appear to have about as
powerful an impact on cumulative GHG emissions as changes in per capita
emissions. For example, decreasing Germany’s per capita emissions 90% rather
than 50% while keeping immigration at current levels leads to 15.7 gigatons
fewer emissions by 2100, while the difference between reducing German net
migration to ½ current levels and increasing it to 2X current levels spans 13.5
gigatons at 50% per capita reductions. For the EU as a whole, cumulative
emissions under a 4X status quo migration/90% per capita emissions reduction
scenario would be more than cumulative emissions under a zero net migration/50%
per capita emissions reduction scenario: 259 vs. 243 gigatonnes CO2e.
These
results show that the implicit assumption is mistaken, at least regarding
climate change. Population size will play an important role in the efforts of
individual EU nations and the EU as a whole to meet their GHG emissions
reduction goals, and immigration policy could play an important role in
facilitating or undermining such efforts.[3]
4 Impacts of human numbers on
EU biodiversity conservation
Biodiversity
loss is as serious a global environmental problem as climate disruption and the
EU and its member states have set ambitious goals for preserving and, where
possible, restoring Europe’s biodiversity. Legal mandates include the Directive
on the Conservation of Wild Birds (European Commission, 2009) and the more
encompassing Directive on the Conservation of Natural Habitats and of Wild
Fauna and Flora (European Commission, 1992): the former decreed “the
conservation of all species of naturally occurring birds in the wild state”
within Europe, by “preserving, maintaining and re-establishing” sufficient
habitat for them; the latter set in motion the creation of a pan-European
network of conservation areas, Natura 2000, to preserve sufficient habitat for
all native plant and animal species (Campagnaro et al., 2019). A review in 2010
showed that despite some progress, “up to 25% of European animal species were
facing extinction, and 65% of habitats of EU importance were in an unfavourable
conservation status, mainly due to human activities” (European Commission,
2015). In response, the EU strengthened its biodiversity protection strategy,
aiming to “halt the loss of biodiversity and ecosystem services by 2020” and
“to restore ecosystems in so far as is feasible” (European Commission, 2011a).
As
with climate change, population growth has been identified as a key factor
driving biodiversity losses around the world (Millennium Ecosystem Assessment,
2005; Driscoll et al., 2018). McKee et al. (2003) found that two factors,
population density and species richness, accounted for 88% of the variation in
countries’ numbers of threatened and endangered species in 2000. Conservation
biologists agree that habitat loss and degradation are by far the leading
causes of biodiversity loss (Maxwell et al., 2016) and a recent study found
that population increases contributed significantly to urbanization and habitat
loss in western Europe between 1990 and 2006 (Weber and Sciubba, 2018).
Increased human numbers have also been shown to multiply other important
factors driving biodiversity loss, including habitat fragmentation (Krishnadas
et al., 2018) and agricultural expansion (Crist et al., 2017). In the UK,
increased human population density has been linked to the extirpation of rare
local plant species (Thompson and Jones, 1999).
Unfortunately,
quantifying biodiversity loss and species extinction in relation to human
population density cannot be done as easily as for GHG emissions and population
size, in part because conservation biologists have failed to give the
relationship between human and wildlife numbers the attention it deserves (Rust
and Kehoe, 2017; Driscoll et al., 2018). Thus, we cannot calculate figures for
likely habitat availability or species extinctions under our five different
immigration scenarios, as we could for future greenhouse gas emissions. Still,
these scenarios lead to great variation in future population densities in
Europe (table 5) and the evidence suggests that future EU population numbers
could greatly influence the success of efforts to preserve biodiversity in the
EU.
Table 5. Population density
(inhabitants per km2)
and percentage change in density: current (2016) and in 2100 under five
migration scenarios. Source: Eurostat 2017 and own calculations.
|
Current inhabitants per km2 |
Density |
|||||
|
Zero net migration |
½ status quo |
Status quo |
2X status quo |
4X status quo |
||
|
European Union |
117.7 |
73.0 (-38%) |
101.2 (-14%) |
105.9 (-10%) |
129.5 (+10%) |
215.4 (+83) |
|
Germany |
233.1 |
144.5 (-38%) |
188.8 (-19%) |
228.4 (-2%) |
319.3 (+37%) |
519.8 (+123%) |
|
France |
105.3 |
95.8 (-9%) |
107.4 (+2%) |
119.0 (+13%) |
142.2 (+35%) |
198.0 (+88%) |
|
UK |
270.6 |
221.9 (-18%) |
278.7 (+3%) |
335.5 (+24%) |
454.6 (+68%) |
722.5 (+167%) |
|
Italy |
205.4 |
102.7 (-50%) |
143.8 (-30%) |
189.0 (-8%) |
275.2 (+34%) |
474.5 (+131%) |
|
Spain |
92.5 |
50.0 (-46%) |
78.6 (-15%) |
110.1 (+19%) |
168.4 (+82%) |
303.4 (+228%) |
Consider
the main targets pursued under the EU’s current biodiversity strategy (European
Commission, 2011a). Target 1 focuses on protecting habitats needed by nonhuman
species, in part by completing the Natura 2000 system of protected areas and
improving their management. Target 2 involves creating “green infrastructure”
that is less environmentally harmful to other species and restoring 15% of
currently degraded ecosystems, improving them as wildlife habitat. Target 3
focuses on making agriculture and forestry less destructive of biodiversity,
either by making production less harmful to other species, or by shifting
agricultural or forestry lands out of production altogether (e.g., by
increasing designated wilderness acreage on public forest lands). Target 4
makes similar efforts to improve fisheries management and increase the number
of marine protected areas. We can sum up these efforts by saying that the EU
biodiversity strategy seeks to increase the amount of habitat available to
other species and improve its quality and effectiveness, both within protected
areas and outside them.
All
these efforts to preserve effective wildlife habitat will be facilitated by
having fewer people and undermined by having more, since they all depend on
reducing human impacts on the habitat that we are trying to protect. We
summarize some of the scientific evidence for this in table 6 below.
Table 6. Summary of recent
scientific evidence that increased human population density drives biodiversity
loss. Also included are studies showing that rural population decrease facilitates increased protected
area acreage. Note: a similar table would be possible, collecting evidence for
how economic sectors that are most harmful to biodiversity are made more
damaging by increased human numbers.
|
Driver of biodiversity decrease (in one case, increase) |
Scientific study affirming increased
population density as a key driver of factor in question |
|
Habitat availability |
|
|
Protected areas “downgraded, downsized, or degazetted” due
to development/settlement pressure |
Radeloff et al., 2010; Watson et al., 2014; Symes et al.,
2016; Qiu et al., 2018; Krishnadas et al., 2018 |
|
Natural areas lost to agriculture or industrial forestry |
Scharlemann et al., 2005; Estrada et al., 2017; Marques et
al., 2019 |
|
Natural areas lost to urbanization, sprawl |
Scharlemann et al., 2005; Seto et al., 2011; Colsaet et
al., 2018; Driscoll et al., 2018; Qiu et al., 2018; Weber and Sciubba, 2018 |
|
Increased protected area acreage facilitated by rural
depopulation |
Navarro and Pereira, 2015a; Corlett, 2016; DeSilvey and
Bartolini, 2018 |
|
Habitat quality or effectiveness |
|
|
Increased habitat fragmentation by human settlements,
transportation corridors, other factors |
Radeloff et al., 2010; Estrada et al., 2017; Driscoll et
al., 2018; Krishnadas et al., 2018; Qiu et al., 2018; Tucker et al., 2018 |
|
Increased pollution, both ecotoxicity and eutrophication |
Turvey, 2008; Driscoll et al., 2018 |
|
Increased hunting pressure |
Stanford, 2012; Boitani and Linnell, 2015 |
|
Increased spread of invasive species |
Driscoll et al., 2018 |
|
Increased climate disruption |
IPCC, 2007; IPCC, 2014; Marques et al., 2019 |
While
the complexity of the phenomenon prevents us from affirming a strict 1:1
inverse relationship, the overall trend is clear: greater human numbers reduce
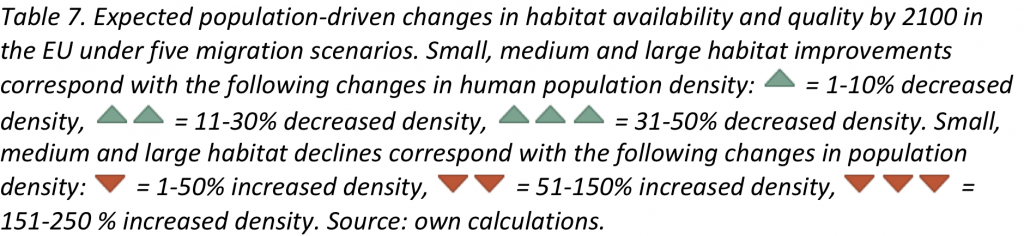
biodiversity. Knowing that changes in human population density correlate well
with changes in habitat availability and quality, both generally (Seto et al.,
2011; Symes et al., 2016; Khrishnadas et al., 2018) and specifically in Europe
(Thompson and Jones, 1999; Navarro and Pereira, 2015a; Lehsten et al., 2015;
Weber and Sciubba, 2018), we sketch broadly the impacts of changing population
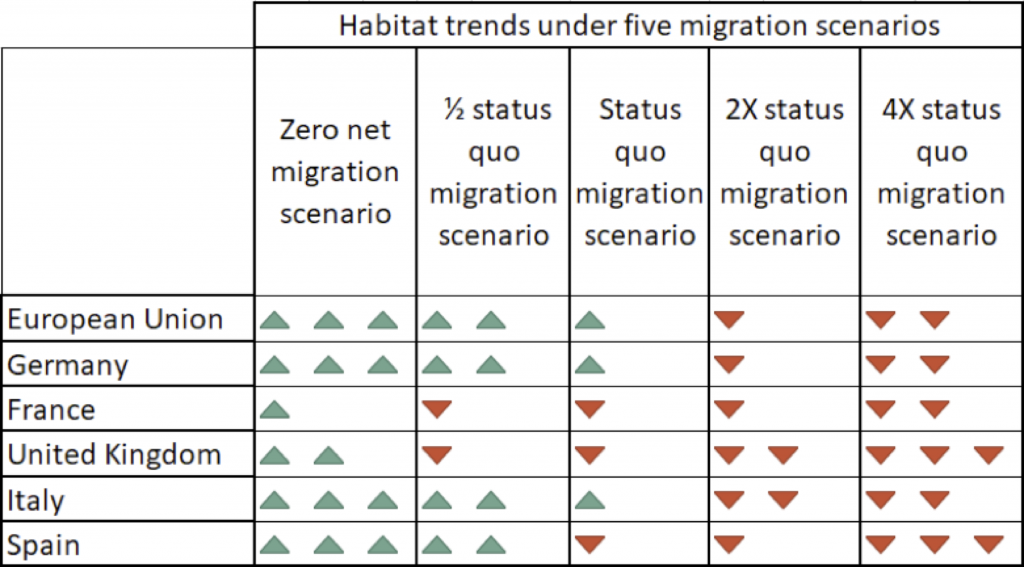
densities on biodiversity preservation in the EU in table 7.
Just
as every extra individual, now and in the future, will generate some GHGs and
thus help heat Earth’s climate, with more individuals generating greater
climate change, so every extra individual, now and in the future, will take
some habitat and resources away from other species, with more individuals
generating greater biodiversity losses. Habitat losses or degradation caused by
population increases could be mitigated by other factors, such as more
efficient use of resources and better management of protected areas. But
habitat increases or improvements caused by population decreases could be
boosted by those same factors. Under all possible environmental futures, lower
human population densities clearly will be better for other species.
As
further evidence, consider the impact of recent EU population decreases in
furthering ecological restoration, a cornerstone of the EU’s biodiversity
preservation strategy. Since 1960, Europe’s rural population has declined by
20% (United Nations, 2014), contributing to extensive farmland “abandonment.”
Within the past two decades, up to 7.6 million hectares of agricultural land
have gone out of production in Eastern Europe, southern Scandinavia and
Europe’s mountainous regions, as have 10-20% of the agricultural lands in the
Baltic states (Leal Filho et al., 2017). Overall, these trends have been
valuable for wildlife, particularly for larger herbivores and carnivores
(Deinet et al., 2013; Boitani and Linnell, 2015). One promising European
organization working for restoration of large natural areas, Rewilding Europe,
acknowledges the positive role of rural population decreases, and most of their
projects include ecological restoration of abandoned agricultural lands
(Rewilding Europe, 2019). In turn, nature-based tourism can create jobs that
benefit younger residents (Navarro and Pereira, 2015b).
Continued
population reductions and release of land from agriculture could contribute
even more to such successes in the future, helping European nations to meet and
hopefully exceed their targets for restoring degraded ecosystems and increasing
protected area acreage. The population of predominantly rural regions is
projected to fall by another 7.9 million people by 2050 (ESPON, 2017).
According to the Institute for European Environmental Policy, an additional
3–4% of total EU land will go out of production by 2030, with 126,000–168,000 km2 potentially
available for nature restoration (Keenleyside and Tucker, 2010). Other
estimates range from 5 to 15% of agricultural areas (arable land and pasture),
or 10 to 29 million hectares of land released between 2000 and 2030 (Verburg
and Overmars, 2009). Many factors influence land abandonment, such as
urbanisation and the profitability of various farming practices. But if
population declines accelerate, more agricultural land within the EU could be
released from intensive human use over the course of this century, while if
population declines are reversed, less land is likely to be available for
ecological restoration or biodiversity-sensitive agriculture or forestry. Since
resource demands cross national boundaries, lower populations would also help
EU nations reduce their negative impacts on biodiversity elsewhere, another key
target of the EU biodiversity strategy (European Commission, 2011a).
Of
course, realizing the benefits of population decreases for wildlife depends on
putting in place the right policies and management (Cerqueira et al., 2015;
Navarro and Pereira, 2015b)—just as in the case of greenhouse gas emissions.
Unfortunately, the potential benefits of smaller populations have largely been
ignored by European policy makers, who tend to view decreased agricultural
activity as a problem, rather than an opportunity (Queiroz et al., 2014). Under
the European Common Agriculture Policy (CAP) “less favored areas” (i.e., areas
where agricultural use is less profitable) have been designated mainly to
maintain agricultural production, regardless of its appropriateness. The
largest amounts of funding for biodiversity conservation are available through
EU and national agro-environmental schemes aimed at preserving traditional
farming systems and reversing abandonment trends (Navarro and Pereira, 2015b).
These support biodiversity preservation efforts in many rural areas (Zingg et
al. 2019), but simultaneously CAP encourages large-scale intensive agriculture
which displaces biodiversity on many other lands (Pe’er et al., 2014).
Conservation policies should include keeping extensive acreages of traditional
farmlands, while also recognizing that some former agricultural lands can be
given back to nature through rewilding (Corlett 2016). Both kinds of efforts
are needed and both would be furthered by smaller populations.
Once
again, then, the evidence seems clear that “the implicit assumption” is mistaken.
Population size will play an important role in EU efforts to preserve
biodiversity, and immigration policy could play an important role in
facilitating or undermining such efforts.
5 Conclusion
In
the absence of convincing evidence to the contrary, what holds true for climate
change and biodiversity loss can be presumed to hold true more generally. The
implicit assumption under which most EU environmental advocates and
policymakers have labored in recent decades appears mistaken. Population size
will play an important role in the efforts of EU nations to meet their future
environmental challenges. Reducing immigration can help create ecologically
sustainable societies that share the landscape generously with other species,
while increasing immigration will tend to move EU nations further away from
these goals.[4]
One
straightforward policy implication, based on the EU’s strong environmental
commitments, might be that European nations with high immigration levels, like
Germany, Spain and the United Kingdom, should reduce them. Countries with
stable or declining populations, like Italy, Poland, Hungary and the
Netherlands, could embrace rather than fight these demographic trends (Götmark
et al., 2018). Alternately, EU nations could reduce their current environmental
commitments, increase immigration and embrace even denser human populations.
Sustainability is not the only proper goal of policy-making. Arguably however,
it is a fundamental goal, necessary to long-term societal flourishing
(Millennium Ecosystem Assessment, 2005; European Commission, 2011b; Foreman and
Carroll, 2014).
At a
minimum, EU citizens deserve an honest discussion of how immigration policies
will impact their environmental goals going forward, since demographic trends
are not set in stone but strongly depend on public policies (Lutz et al., 2019;
Cafaro and Dérer, 2019). Whatever immigration policies are decided on should
respect the claims of justice, including the rights of refugees and would-be
immigrants to fair treatment (Miller, 2016), the rights of EU citizens to
democratically choose policies that will affect their societies in fundamental
ways (Phillips, 2018) and the rights of other species not to be extinguished by
human beings (Staples and Cafaro, 2012). But they also must respect the reality
of ecological limits to safe human resource use, which humanity is already
seriously transgressing (Ripple et al., 2017; O’Neill et al., 2018). Partha
Dasgupta (2019) recently wrote, “to me it remains a puzzle that population
[ethicists] haven’t subjected their reasoning to a world facing
socio-ecological constraints of the kind we have now come to know.” As we have
shown, policy-makers also tend to avoid subjecting their reasoning to such
constraints. We believe the time for such avoidance is over.
Notes
[1] Note that past, present and future
numbers for “the EU” include all the EU’s current members, including the UK.
[2] While allowing former farmlands to regrow
forests can provide significant carbon removal from the atmosphere, scaling up
such negative emissions will demand more energy- and technology-intensive
methods as well.
[3] One might object that any increase in EU
countries’ GHG emissions from immigration would be offset by emissions
reductions in the EU’s sender countries. But this is unlikely; since
immigration into the EU tends to move people from countries with lower per
capita emissions to ones with higher per capita emissions, overall emissions
are likely to increase, as has been the case with immigration into the US
(Kolankiewicz and Camarota, 2008).
[4] Similar arguments hold for Australia
(Smith, 2011) and the United States (Cafaro, 2015).
References
Azose,
J.J. et al., 2016. Probabilistic population projections with migration
uncertainty. Proceedings
of the National Academy of Sciences, 113 (23), pp.6460–65.
Balbo,
N. et al., 2013. Fertility in advanced societies: a review of research. European Journal of Population, 29 (1), pp.1–38.
Boitani,
L. and Linnell, J.D.C., 2015. Bringing large mammals back: large carnivores in
Europe. In Pereira H. and Navarro L. eds. 2015. Rewilding European Landscapes.
Cham: Springer International Publishing. pp.67–84.
Bongaarts,
J. and O’Neill, B., 2018. Global warming policy: is population left out in the
cold? Science 361 (6403) pp.650–52.
Cafaro,
P., 2015. How many is too many? The
progressive argument for reducing immigration into the United States.
Chicago: University of Chicago Press.
Cafaro,
P. and Dérer, P., 2019. Policy-based population projections for the European
Union: a complementary approach. Comparative
Population Studies, 44, pp.171-200.
Campagnaro,
T. et al., 2019. Half earth or whole earth: what can Natura 2000 teach us? BioScience, 69, pp.117-124.
Capros,
P. et al., 2016. EU
reference scenario 2016: energy, transport and GHG emissions trends to 2050. [pdf] European Commission. Available
at: <https://ec.europa.eu/energy/sites/ener/files/documents/20160713%20draft_publication_REF2016_v13.pdf>
[Accessed 8 November 2019].
Casey,
G. and Galor, O., 2017. Is faster economic growth compatible with reductions in
carbon emissions? The role of diminished population growth. Environ Res Lett. 12.
Cerqueira,
Y. et al, 2015. Ecosystem services: the opportunities of rewilding in Europe.
In: Pereira H. and Navarro L. eds. 2015. Rewilding
European landscapes. Cham: Springer International Publishing.
pp.47–64.
Colsaet,
A. et al., 2018. What drives land take and urban land expansion? A systematic
review. Land Use Policy, 79, pp.339–349.
Corlett,
R.T., 2016. The role of rewilding in landscape design for conservation. Current Landscape Ecology
Reports, 1,
pp.127–33.
Crist,
E. et al., 2017. The interaction of human population, food production, and
biodiversity protection. Science, 356, pp.260–264.
Dasgupta,
P., 2019. Time and the generations:
population ethics for a diminishing planet. New York: Columbia
University Press.
Deinet,
S. et al., 2013. Wildlife
comeback in Europe: the recovery of selected mammal and bird species. Final
report to Rewilding Europe. London:
ZSL.
DeSilvey,
C. and Bartolini, N., 2018. Where horses run free? Autonomy, temporality and
rewilding in the Côa valley, Portugal. Transactions
of the Institute of British Geographers, Volume 44, Issue 1,
pp.94-109.
Die
Grünen, 2017. Inklusions-Bericht. 2017. [pdf] Available at: <https://www.gruene.at/partei/programm/gruene-teilprogramme/der-gruene-inklusionsbericht.pdf>
[Accessed 8 November 2019].
Driscoll,
D. et al., 2018. A biodiversity-crisis hierarchy to evaluate and refine
conservation indicators. Nature:
Ecology & Evolution, 2: 775–781.
Estrada,
A., 2017. Impending extinction crisis of the world’s primates: why primates
matter. Science Advances.
[e-journal] Vol. 3, no. 1, e1600946. DOI: 10.1126/sciadv.1600946
European
Spatial Planning Observation Network (ESPON), 2017. Policy brief: shrinking rural
regions in Europe. Available
at: <https://www.espon.eu/rural-shrinking> [Accessed 9 November 2019]
European
Commission, 1992. Council
directive 92 / 43 / EEC of 21 May 1992 on the conservation of natural habitats
and of wild fauna and flora. [online]
Available at:
<https://eur-lex.europa.eu/legal-content/EN/TXT/HTML/?uri=CELEX:31992L0043&from=EN>
[Accessed 9 November 2019].
European
Commission, 2005. Green
paper. Confronting
demographic change: a new solidarity between the generations. [pdf]
Available at:
<https://eur-lex.europa.eu/legal-content/EN/TXT/PDF/?uri=CELEX:52005DC0094&from=EN>
[Accessed 9 November 2019].
European
Commission, 2009. Directive
2009/147/EC of the European Parliament and of the Council of 30 November 2009
on the conservation of wild birds. [online] Available at:
<https://eur-lex.europa.eu/legal-content/EN/TXT/HTML/?uri=CELEX:32009L0147&from=EN>
[Accessed 9 November 2019].
European
Commission, 2011a. Our
life insurance, our natural capital: EU biodiversity strategy to 2020. [pdf] Available at:
<https://www.eea.europa.eu/publications/eu-2010-biodiversity-baseline/at_download/file>
[Accessed 9 November 2019].
European
Commission, 2011b. Roadmap
to a resource efficient Europe. COM (2011) 571 final. [online] Available at:
<https://www.eea.europa.eu/policy-documents/com-2011-571-roadmap-to>
[Accessed 9 November 2019].
European
Commission, 2011c. The
global approach to migration and mobility. COM (2011) 743 final. [online] Available at:
<https://ec.europa.eu/home-affairs/what-we-do/policies/international-affairs/global-approach-to-migration_en>
[Accessed 9 November 2019].
European
Commission, 2014. Population
ageing in Europe: facts, implications, and policies. [pdf] Available at:
<https://ec.europa.eu/research/social-sciences/pdf/policy_reviews/kina26426enc.pdf>
[Accessed 9 November 2019].
European
Commission, 2015. The
mid-term review of the EU biodiversity strategy to 2020. COM (2015) 478 final. [pdf] Available at:
<https://eur-lex.europa.eu/resource.html?uri=cellar:5254559f-68eb-11e5-9317-01aa75ed71a1.0001.02/DOC_2&format=PDF>
[Accessed 9 November 2019].
European
Commission, 2018. A
clean planet for all: a European strategic long-term vision for a prosperous,
modern, competitive and climate neutral economy. COM (2018) 773. [pdf] Available at:
<https://eur-lex.europa.eu/LexUriServ/LexUriServ.do?uri=COM:2018:0773:FIN:EN:PDF>
[Accessed 9 November 2019].
European
Commission, 2019. Progress
report on the Implementation of the European agenda on migration. COM (2019)
126 final. [online]
Available at:
<https://eur-lex.europa.eu/legal-content/EN/TXT/HTML/?uri=CELEX:52019DC0126&from=EN>
[Accessed 9 November 2019].
European
Council. 2014. 2030
climate and energy framework. EUCO 169/14.[online] Available at:
<https://ec.europa.eu/clima/policies/strategies/2030_el> [Accessed 9
November 2019].
European
Greens, 2019a. Priorities
for 2019: what European greens fight for. [online] Available at:
<https://europeangreens.eu/priorities-2019-what-european-greens-fight>
[Accessed 10 November 2019].
European
Greens, 2019b. Positions.
[online] Available at: <https://europeangreens.eu/positions> [Accessed 10
November 2019].
European
Greens, 2019c. Human
rights & migration. [online] Available at:
<https://europeangreens.eu/positions/human-rights-migration> [Accessed 10
November 2019].
European
Parliament, 2013. Decision
No 1386/2013/Eu of the European parliament and of the Council of 20 November
2013, on a general Union environment action programme to 2020: Living well,
within the limits of our planet. [online] Available at:
<https://eur-lex.europa.eu/legal-content/EN/TXT/HTML/?uri=CELEX:32013D1386&from=EN>
[Accessed 10 November 2019].
Eurostat,
2017. Statistics explained. [online]
Available at:
<https://ec.europa.eu/eurostat/statistics-explained/index.php/Main_Page>
[Accessed 10 November 2019].
Eurostat,
2019. Main tables, immigration and
emigration. [online] Available at:
<https://ec.europa.eu/eurostat/web/population-demography-migration-projections/data/main-tables>
[Accessed 10 November 2019].
Foreman,
D. and Carroll, L., 2014. Man
swarm: how overpopulation is killing the wild world. LiveTrue Books.
Götmark,
F. et al., 2018. Aging human populations: good for us, good for the Earth. Trends in Ecology &
Evolution, 33:
pp.851–62.
Intergovernment
Panel on Climate Change (IPCC), 2007. AR4
climate change 2007: mitigation of climate change. [online]
Available at: <https://www.ipcc.ch/report/ar4/wg3/> [Accessed 10 November
2019].
Intergovernment
Panel on Climate Change (IPCC), 2013. Climate
change 2013: The physical science basis. [online] Available at:
<https://www.ipcc.ch/report/ar5/wg1/> [Accessed 10 November 2019].
Intergovernment
Panel on Climate Change (IPCC), 2014. AR5
climate change 2014: mitigation of climate change. [online]
Available at: <https://www.ipcc.ch/report/ar5/wg3/> [Accessed 10 November
2019].
Kallis,
G., 2018. Degrowth. New York:
Columbia University Press.
Keenleyside,
C. and Tucker, G., 2010. Farmland
abandonment in the EU: an assessment of trends and prospects. London: World Wildlife Fund and
Institute for European Environmental Policy.
Kolankiewicz,
L. and Camarota, S.A., 2008. Immigration
to the United States and world-wide greenhouse gas emissions. Washington, D.C.: Center for
Immigration Studies.
Krishnadasa,
M. et al., 2018. Parks protect forest cover in a tropical biodiversity hotspot,
but high human population densities can limit success. Biological Conservation,
223, pp.147–155.
Kulu,
H. et al., 2017. Fertility by birth order among the descendants of immigrants
in selected European countries. Population
and Development Review. 43, pp.31–60.
Leal
Filho, W. et al., 2017. An assessment of the causes and consequences of
agricultural land abandonment in Europe. International
Journal of Sustainable Development and World Ecology, 24,
pp.554–60.
Lehsten,
V. et al., 2015. Disentangling the effects of land-use change, climate and CO2 on
projected future European habitat types. Global
Ecology and Biogeography, 24, pp.653–63.
Lenzi
D. et al., 2018. Don’t deploy negative emissions technologies without ethical
analysis. Nature, 561,
pp.303–5.
Lutz
W. et al., 2019. Demographic
scenarios for the EU: migration, population and education. Luxembourg: Publications Office of the
European Union.
Marques,
A. et al. 2019. Increasing impacts of land use on biodiversity and carbon
sequestration driven by population and economic growth. Nature: Ecology &
Evolution, 3,
pp.628–637.
Millennium
Ecosystem Assessment, 2005. Ecosystems
and human well-being: biodiversity synthesis. Washington, D.C.: World Resources
Institute.
Miller,
D., 2016. Strangers in our midst: the
political philosophy of immigration.Cambridge: Harvard University
Press.
Navarro,
L.M. and Pereira, H.M., 2015a. Rewilding abandoned landscapes in Europe. In:
Pereira H. and Navarro L. eds. 2015. Rewilding
European landscapes. Cham: Springer International Publishing.
pp.3–23.
Navarro,
L.M. and Pereira, H.M., 2015b. Towards a European policy for rewilding. In:
Pereira H. and Navarro L. eds. 2015. Rewilding
European landscapes. Cham: Springer International Publishing.
pp.205–223.
O’Neill,
B.C. et al., 2012. Demographic change and carbon dioxide emissions. The Lancet, 380, pp.157–64.
O’Neill,
D.W. et al., 2018. A good life for all within planetary boundaries. Nature Sustainability, 1,
pp.88–95.
Palmer,
T., 2012. Beyond futility. In: Cafaro, P. and Crist, E. eds. 2012. Life on the brink:
environmentalists confront overpopulation. Athens: University of
Georgia Press. pp.98-107.
Pe’er,
G. et al., 2014. EU Agricultural reform fails on biodiversity. Science,344,
pp.1090–92.
Pew
Research Center, 2017. Europe’s
growing Muslim population. [online] Available at:
<http://www.pewforum.org/2017/11/29/europes-growing-muslim-population/>
[Accessed 10 November 2019].
Phillips,
A., 2018. Immigration ethics: creating
flourishing, just, and sustainable societies in a world of limits. Master’s thesis, Colorado State
University.
Queiroz,
C., et al., 2014. Farmland abandonment: threat or opportunity for biodiversity
conservation? A global review. Frontiers
in Ecology and the Environment, 12, pp.288–96.
Qiu,
C. et al., 2018. Human pressures on natural reserves in Yunnan province and
management implications. Scientific
Reports, [e-journal] 8, 3260. DOI:10.1038/s41598-018-21654-w.
Radeloff,
V. et al., 2015. Housing growth in and near United States protected areas
limits their conservation value. PNAS, 107, pp.940–945.
Rees,
P. et al., 2012. European regional populations: current trends, future
pathways, and policy options. European
Journal of Population / Revue Européenne de Démographie, 28,
pp.385–416.
Ripple,
W.J. et al., 2017. World scientists’ warning to humanity: a second notice. BioScience, 67, pp.1026–28.
Rust,
N. and Kehoe, L., 2017. A call for conservation scientists to empirically study
the effects of human population policies on biodiversity loss. Journal of Population and
Sustainability, 1
(2), pp.53-66.
Seto
K.C., 2011. A meta-analysis of global urban land expansion. PLoS ONE,
[e-journal] 6, e23777. doi:10.1371/journal.pone.0023777.
Scharlemann,
J., 2005. The level of threat to restricted-range bird species can be predicted
from mapped data on land use and human population.Biological Conservation,
123, pp.317–326.
Smith,
D., 2011. Dick Smith’s population crisis:
the dangers of unsustainable growth for Australia. Sydney: Allen & Unwin.
Sobotka,
T., 2008. Overview chapter 7: the rising importance of migrants for
childbearing in Europe. Demographic
Research, 19.
pp.225–48.
Staples,
W. and Cafaro, P., 2012. For a species right to exist. In: Cafaro, P. and
Crist, E. eds. 2012. Life
on the brink: environmentalists confront overpopulation. Athens:
University of Georgia Press. pp.283-300.
Stanford,
C., 2012. Planet without apes. Cambridge:
Harvard University Press.
Symes,
W. et al., 2016. Why do we lose protected areas? Factors influencing protected
area downgrading, downsizing and degazettement in the tropics and subtropics. Global Change Biology,
[e-journal] 22, pp.656–665. doi: 10.1111/gcb.13089.
Thompson,
K. and Jones, A., 1999. Human population density and prediction of local plant
extinction in Britain. Conservation
Biology, 13, pp.185-189.
Tucker,
M. et al., 2018. Moving in the Anthropocene: global reductions in terrestrial
mammalian movements. Science,
359, pp.466–469.
Turvey,
S., 2008. Witness to extinction: how we
failed to save the Yangtze River Dolphin. Oxford: Oxford University
Press.
United
Nations, 2014. 2014
revision of the world urbanization prospects. [online] Available
at: <https://www.un.org/en/development/desa/publications/2014-revision-world-urbanization-prospects.html>
Accessed 10 November 2019].
United
Nations, 2019. World
population prospects. [online] Available at:
<https://population.un.org/wpp/> [Accessed 10 November 2019].
UK
Green Party, 2003. Population.
[online] Available at: <https://policy.greenparty.org.uk/pp.html>
[Accessed 10 November 2019].
UK
Green Party, 2017. Migration.
[online] Available at: <https://policy.greenparty.org.uk/mg.html>
[Accessed 10 November 2019].
Van
Vuuren D.P. et al., 2018. Alternative pathways to the 1.5 °C target reduce the
need for negative emission technologies. Nature
Climate Change, 8, pp.391–7.
Verburg,
P.H. and Overmars, K.P., 2009. Combining top-down and bottom-up dynamics in
land use modeling: exploring the future of abandoned farmlands in Europe with
the Dyna-CLUE model. Landscape
Ecology, 24, pp.1167–81.
Watson,
J.E. et al., 2014. The performance and potential of protected areas. Nature 515, pp.67–73.
Weber,
H. and Sciubba, J.D., 2018. The effect of population growth on the environment:
evidence from European regions. European
Journal of Population, [e-journal] April 9, 2018.
https://doi.org/10.1007/s10680-018-9486-0
Wynes,
S. and Nicholas, K.A., 2017. The climate mitigation gap: education and
government recommendations miss the most effective individual actions. Environmental Research Letters, [e-journal] 12.
https://doi.org/10.1088/1748-9326/aa7541
Zingg,
S. et al., 2019. Increasing the proportion and quality of land under
agri-environment schemes promotes birds and butterflies at the landscape scale. Biological Conservation,
231, pp.39-48.