Anticipating urbanization-led land cover
change and its impact on local climate using time series model: a study on
Dhaka city
First online: 19 March 2020
Ripan
Debnath
Department
of Environmental Science and Management, North South University, Dhaka,
Bangladesh
–––––––––––––––––––––––––––––––––––––––––––
DOI: 10.3197/jps.2020.4.2.45
Licensing: This article is Open Access (CC BY 4.0).
How to Cite:
Debnath, R. 2016. 'Anticipating urbanization-led land cover change and its impact on local climate using time series model: a study on Dhaka city'. The Journal of Population and Sustainability 4(2): 45–66.
https://doi.org/10.3197/jps.2020.4.2.45
–––––––––––––––––––––––––––––––––––––––––––
Abstract
Urbanization-led changes in
natural landscape often result in environmental degradation and subsequently
contribute to local climate variability. Therefore, apart from global climate
change, Dhaka city’s ongoing rapid urban growth may result in altering future
local climate patterns significantly. This study explores transition
relationships between urbanization (population), land cover, and climate
(temperature) of Dhaka city beginning in 1975 through to forecast scenarios up
to 2035. Satellite image, geographic, demographic, and climatic data were
analyzed. Change in core urban land cover (area) was regarded as a function of
population growth and was modeled using linear regression technique. The study
developed and validated a time series (ARIMA) model for predicting mean maximum
temperature change where (forecasted) land cover scenarios were regressors.
Throughout the studied period, the city exhibited an increasing urbanization
trend that indicated persistent growth of core urban land cover in future. As a
result, the city’s mean maximum temperature was found likely to increase by
around 1.5-degree Celsius during 2016-2035 on average from that of observed
1996-2015 period. It is expected that findings of this study may help in
recognizing urbanization-led climate change easily, which is crucial to
effective climate change management actions and urban planning.
Keywords:
urbanization; land cover; climate change; time series model; Dhaka city
1.
Background
Urbanization
is the process of growth in the proportion of a country’s total urban
population (Thomas, 2008). The majority of the global population currently
live in urban areas, in 2018 this amounted to more than 4 billion people (UN
DESA, 2019) and this number is growing at an annual rate of nearly 2% (World
Bank, 2018). By 2050, proportion of the global urban population is likely to rise
to 68% which will be mostly contributed by countries in Asia and Africa where
the rate of urbanization is most rapid (UN DESA, 2019). Relevantly, it has been
predicted that Dhaka will have more than 28 million people by 2030 (UN DESA,
2019). Dhaka is the capital of Bangladesh and the center of political, cultural
and economic life. After liberation in 1971, the population of Dhaka started to
rise sharply and since 1991 Dhaka has experienced remarkable urban growth
(Rahman, et al., 2008). The previous annual population growth rate of Dhaka
city of 4.2% (Biswas, et al., 2010) has recently shrunk to 3.48% (BBS,
2012). A study conducted by the World Bank revealed that sprawl intensity and
coverage were increasing day by day within the Dhaka Statistical Metropolitan
Area (World Bank, 2011). The probable reasons for this trend are
population boom, very high land price in planned areas, development management
inefficiency, etc. Therefore, historical change and urban growth pattern
monitoring of Dhaka Metropolitan Area using remote sensing technologies (Ahmed,
et al., 2013; Ahmed & Ahmed, 2012; Dewan & Yamaguchi, 2009a; Dewan
& Yamaguchi, 2009b) have been of great interest to the scientific
community.
Urbanization
is always accompanied by several changes in socio-economic, cultural and
demographic settings (Khoury, 1982). When characterized by rapid
population growth, sprawl, poverty, etc., it creates stress in the urban
environment, triggering environmental problems and risks for urban
inhabitants (WHO, 2000). In this regard, Dhaka city is anticipated to be
affected in two major ways; heat stress and flooding (multiplied by drainage
congestion) as consequences of ongoing climate change (UN-HABITAT, 2008; Alam
& Rabbani, 2007). A slight rise in sea level may engulf large parts of the
city and negative consequences are likely to be felt by a large number of
people; especially the urban poor who live in flood-prone and waterlogged
areas (UN-HABITAT, 2008). Thus, the city needs to develop advanced
knowledge of potential climate change, its impact and the mechanisms to
overcome the situation.
Climate
change has forced many rural people in Bangladesh to migrate to cities and this
has caused a sharp rise in the slum population of Dhaka (Aulakh, 2013).
Climate change is a global issue with great importance requiring adaptation and
mitigation (United Nations, n.d.) otherwise a cascade of naturally triggered
disasters will devastate the known forms of life on earth. . “Climate change impacts and consequences can wipe out development
gains and significantly reduce the standard of living“ (Prasad, et al., 2009 p.10). Yet, cities
can take active steps to minimize climate change induced or other natural
disaster risks/impacts by improving planning, creating effective infrastructure
and establishing disaster preparedness. In this regard, climate change
prediction can help in developing local prevention, mitigation and adaptation
strategies to minimize probable loss.
Due
to urbanization, the increased demand for land for non-agricultural purposes
(e.g. for urban residential and industrial use) is the main driver of land use
and land cover[1] change
(LULCC) (Coskun, et al., 2008). Evidence shows that LULCC has effects on
climate change (Dale, 1997; Thompson, et al., 2011). As with the production of
greenhouse gases, LULCC has significant effects on atmosphere, climate and sea
level in both global and local systems (Meyer & Turner, 1992; Pielke, 2005;
Hong Kong Observatory, 2012). Land cover change by new city elements and their
surface materials alters energy, water exchanges and airflow. Urban climate
also varies with these factors in a conjunction with direct anthropogenic
emissions of heat, CO2 and pollutants (Grimmond, 2007). For
instance, “…small changes of 100 square kilometers in urban development or
deforestation can change local rainfall patterns and trigger other climate
disruptions” (Climate Future Group, 2006).
From
the above discussion, it is clear that Dhaka city is at risk of facing negative
environmental consequences propelled by ongoing rapid urbanization. Migrating
population, voluntary and forced (e.g. environmentally displaced), is adding
pressure to the city at a significantly higher rate (6%) than the country’s
overall rate of internal migration (4.5%) (Xinhua, 2013; Khan, 2012). These
migrants, typically unskilled and having lost their livelihoods, merge into the
urban poor and often become even poorer than before migrating (Stojanov, 2005).
They generally settle in low-lying flood prone areas in cities and gradually
transform urban ecosystems and landscapes (UNU-IHDP, 2015) resulting in
environmental degradation. Given predicted climatic vulnerability, it is
necessary to anticipate urbanization-induced land cover change and associated
future climate change so that proper adaptation and mitigation measures can be
planned and initiated.
2. Objective and Scope
The
objective of this study is to ascertain changes in future climate of Dhaka city
in relation to the predicted land cover change using long term observational
data. The study assumes that land cover change due to future urbanization is
likely to bring changes on climate pattern of the study area. Hence, it targets
to understand and explore the underlying relationships among urban population,
land cover, and climatic parameter based on historical evidences. For
performing the study, Dhaka Metropolitan Development Planning (DMDP) area is
taken into consideration. It includes city corporation areas and other some
peripheral urban centers and localities, which is governed by the Rajdhani Unnayan Kartripakkha (RAJUK) i.e. capital city development
authority. The extent of the DMDP area is around 1439 km2 (RAJUK, 2011) which is shown in
Figure 1 along with local administrative Thana[2] and Upazila[3] boundaries.
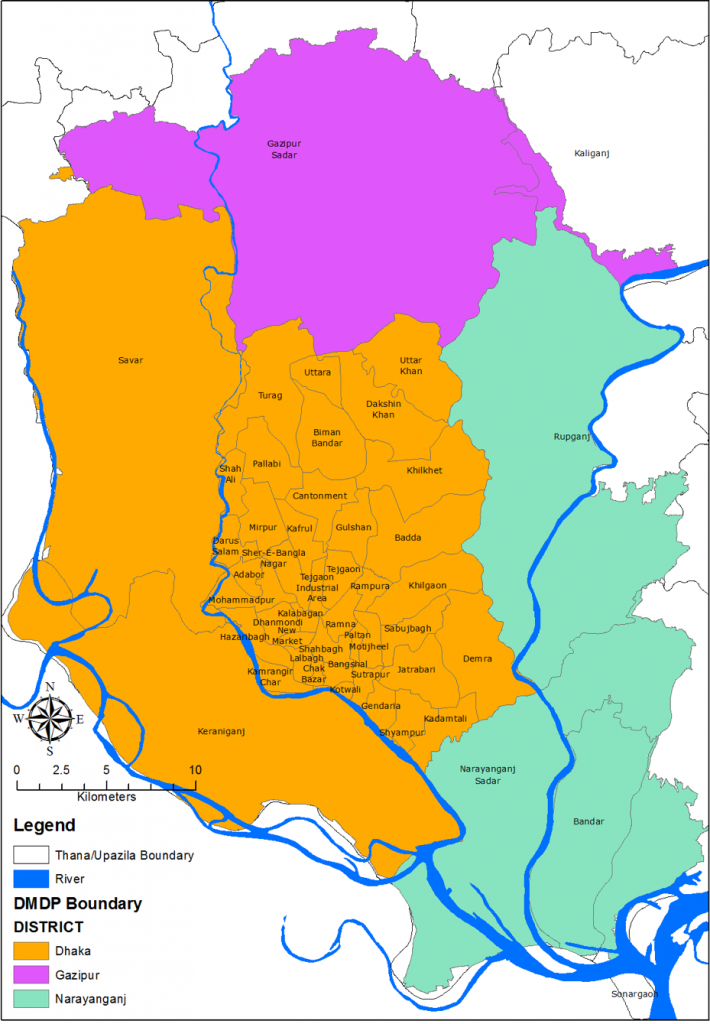
Figure 1: Administrative Map of
the Study Area
Among
different factors of urbanization economic growth, industrialization, exports,
residential GNP per capita, agricultural productivity, size of total
population, start date of modernization etc. are very dominant (Bairoch &
Goertz, 1986). However, the study does not investigate the factors behind
Dhaka’s urbanization but examines its trends. The study recognizes change in
urban population and land cover as the consequences of change in social,
economic and policy aspects as well as the management efficiency or
inefficiency of the concerned authorities.
3.
Method
Most
commonly, remote sensing and Geographic Information System (GIS) are used to
monitor and measure land-use changes. Numerous researchers have worked with
multi-temporal digital satellite imagery and GIS database for comparing and
assessing LULCC (Coskun, et al., 2008; Reis, 2008; The World Bank, 2012;
Malaque & Yokohari, 2007; Gregorio & Jansen, 2005; Thompson, et al.,
2011; Long, et al., 2007).
In
climate change prediction/research, time series data and autoregressive
integrated moving average (ARIMA) model has
been frequently employed (Piwowar & Ledrew, 2002; Romilly, 2005; Ye, et
al., 2013; Afrifa-Yamoah, 2015). This study has followed a similar method by
developing a time series (1975-2015) database and ARIMA model with regressors
for predicting climate change. Notably, regional climate change measurement
accounts for maximum temperature trends only (Pielke, 2005). Therefore, the
study attempts to predict change in mean maximum temperature of Dhaka city to
ascertain probable climate change. This study’s urban population, land cover,
and maximum temperature predictions follow the timeframe (2016-2035) of the
DMDP’s second Structure Plan[4] (RAJUK, 2015). The study’s detailed
methodological aspects are described in the following sub-sections.
3.1 Land cover Data
The
study collected historical Landsat images (multispectral only) of the Dhaka
region for 1975, 1989, 1999 & 2006 from the official data archive of the
U.S. Geological Survey (USGS, n.d.). It worth mentioning that available images
for 1975, 1989, and 1999 in the archive did not cover the DMDP (area of
interest) entirely, consequently the next available years’ data were collected
(Table 1). The downloaded data, having less than 10% cloud coverage, were then
projected to the Universal Transverse Mercator (UTM) – Zone 46 North with the
World Geodetic System (WGS) – 1984 datum. Spatial resolution of these images
was 30 × 30 meters except for 1975 images (Table 1) which were resampled to
this specification. Apart from this, no further pre-processing was performed.
Seasonality was ignored as all images were captured between November and March,
which broadly falls in winter. As greeneries/vegetation, open space, and
waterbodies contribute greatly in regulating local climate (Bolund &
Hunhammar, 1999), the study has extracted land cover data under the following
four categories:
1. Dense/Core Urban:
densely developed urban lands areas within the study area.
2. Underdeveloped (Non-Urban &
Agriculture): rural settlement, vacant/ open space, agricultural lands,
services/ institutional area, proposed urban area, etc..
3. Green/Reserved:
homestead vegetation, forests, parks, restricted and reserved lands/ playgrounds,
etc..
4. Waterbody:
marshland, river, canal, pond, etc. areas.
Table 1: Particulars of
collected Landsat images from the USGS archive
|
Data year (as regarded) |
Acquisition Date |
Path/ Row |
Coverage of the study area |
Sensor |
Pixel size (meters) |
|
1975 |
27-Mar-75 |
147/43 |
85% |
MSS |
60 x 60 |
|
08-Feb-77 |
147/44 |
15% |
|||
|
1989 |
04-Nov-89 |
137/44 |
85% |
TM |
30 x 30 |
|
26-Nov-91 |
137/43 |
15% |
|||
|
1999 |
24-Nov-99 |
137/44 |
85% |
ETM+ |
30 x 30 |
|
28-Feb-00 |
137/43 |
15% |
|||
|
2006 |
27-Jan-06 |
137/43 and 137/44 |
100% |
ETM+ |
30 x 30 |
Supervised
Classification method, where user/analyst selects representative samples for
each land cover category in the digital image, was applied during image
analysis. To test accuracy of classified outputs, a total 100 stratified random
samples were taken from four land cover classes. The Urban Area Plan
(1995-2005) (RAJUK, 1995) and Detailed Area Plan[5] (DAP)
(RAJUK, 2010) maps as well as high resolution Google Earth images were used
while checking representativeness of actual land cover in the classification
outputs. The overall accuracy of 1975, 1989, 1999, and 2006 classified images
were 85%, 90%, 88%, and 91% with Kappa coefficients of 0.80, 0.86, 0.84, and
0.88 respectively. As the accuracy figures met the standard requirement for
LULCC studies (Dewan & Yamaguchi, 2009a), no further actions to improve
these classification outputs was taken. Total area under different land cover
categories from the analyzed four image sets were calculated, summarized, and
stored. Furthermore, recent land cover statistics from 2013 were extracted from
generalized land use data used in the structure plan (RAJUK, 2015)
preparation work. At the end of this stage, land cover information of five
different periods (1975, 1989, 1999, 2006 and 2013) were prepared and
accumulated for further analyses.
3.2 Demographic Data
The
study has collected population census data from the years 1981 (BBS, 1981),
1991 (BBS, 1991), 2001 (BBS, 2001) and 2011 (BBS, 2012) for Dhaka, Gazipur and
Narayanganj Districts (falling within the DMDP area). Here, enumerated
population under corresponding Thanas and Upazilas (administrative regions)
were considered. For calculating partial population at the periphery, overlying
Upazila area (part) was multiplied by the gross population density of that
particular Upazila as no other spatially distributed demographic data for that
area were found.
3.3 Climatic Information
Climatic
information, recorded at Dhaka station, were collected from Bangladesh
Meteorological Department (BMD, 2017) for the 1975-2015 period. Monthly maximum
temperature values, in degree Celsius (°C), were arithmetically averaged to
obtain the yearly mean maximum temperature (hereafter referred as temperature).
3.4 Time Series Database
At
this stage, Underdeveloped (Non-Urban & Agriculture) and Green/Reserved
land covers are aggregated into one category named ‘Potential Urban’ as lands
under those categories are believed to be most suitable for urban functions and
uses (Naab & Dogkubong, 2013). Finally, a time series database,
starting from 1975, has been developed by combining three land cover (core
urban, potential urban & waterbody) categories, population, and temperature
data. To obtain in-between population and land cover figures of two base years,
linear interpolation method was applied.
3.5 Forecasting Method &
ARIMA Model
Population
to the year of 2035 was projected using graphical method (FHWA, 2001).
Moreover, exponential forecasting method (using F1 and F2) (George, et al.,
2004) was applied since Dhaka experienced a near exponential growth trend in recent decades (Iqbal & Khan, 2005). The study
compared those two outcomes and considered the lowest figure as the minimum
probable population by the predicting year for further analyses.

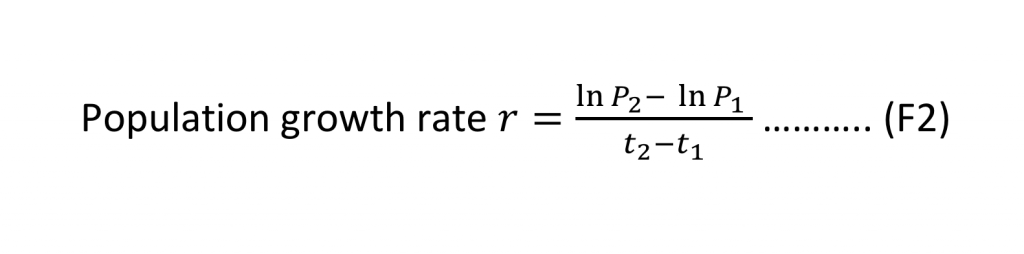
3.6 Population of forecasted
year
The
study followed formula F2 for computing population growth rate where P2and P1 were the population of last (t2) and first (t1) assessment
year respectively.
As
the prepared land cover statistics were not originally time series (but sample)
data, a linear regression model was applied to predict its future change. Here,
population growth in the DMDP area has been viewed as a key contributor to core
urban land cover change. Thus, forecasted population was used as the only
regressor in building a linear model for core urban area prediction. Average
annual gain/loss rate of waterbodies (land cover) has been used in forecasting
their future status. Potential urban land cover area was calculated by
deducting the sum of core urban and water-body areas from the total DMDP area.
Land cover change rate(s) within the considered periods was assessed with the
following formula F3 (Long, et al., 2007) where LC2 and LC1were present and
past land cover area respectively for a time interval (t).

The
study developed and applied an ARIMA (time series) model for predicting
temperature change by the year of 2035. Before executing ARIMA, Augmented
Dickey-Fuller test for unit root was performed on collected temperature records
for a stationarity check of the time series. Since the temperature records were
yearly data, seasonality test was not necessary. To identify the appropriate
ARIMA model structure, Autocorrelation Function (ACF) and Partial
Autocorrelation Function (PACF) were tested. Finally, Akaike Information
Criterion (AIC) and Bayesian
Information Criterion (BIC) tests, where lower values signify the best-fitting
model, were performed to determine goodness of fit of the tested ARIMA
model(s). Notably, in the temperature change model, all (predicted) land cover
categories were considered as regressors, since this study aimed to explore the
impact of urban land cover change on the city’s temperature by 2035.
4.
Results
Land
cover statistics obtained from analyses are shown in Figure 2 from which change
rates were calculated for different periods under corresponding land cover
categories (Table 2). During the period 1975-2013, core urban and
underdeveloped land covers were found growing annually at 12% and 1% rate
respectively. However, in contrast, both green and waterbody land (cover) areas
were found decreasing at around and above a rate of 2% per annum respectively.
Total adjusted population of the study area in 2011 was found to be 14.2
million (Figure 3). During 2001-2011 period, population in Gazipur District was
growing at nearly twice the rate (5.4%) per annum compared to the other two
Districts. Interestingly, the population in the peripheral Districts was
observed to be growing at a faster rate than central (below Dhaka District)
region. With the help of forecasting methods discussed in section 3.5, probable
population, land cover and temperature changes for the study area by 2035 (year)
were estimated. The following sub-sections highlight different forecasted
results.
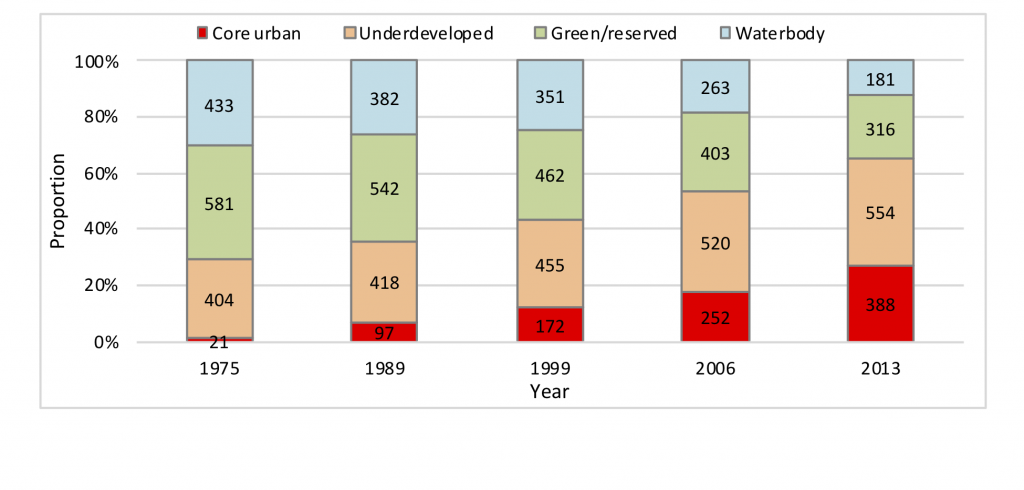
Figure
2: Proportion and area (in km2) of different land-cover
categories during collected data periods
Table 2: Observed land-cover
change rate over the periods
|
Land-cover category |
1975-1989 |
1990-1999 |
2000-2006 |
2007-2013 |
Weighted Average |
|
Core Urban |
26.1% |
7.7% |
6.7% |
7.7% |
12.0% |
|
Underdeveloped |
0.2% |
0.9% |
2.1% |
0.9% |
1.0% |
|
Green/ Reserved |
-0.5% |
-1.5% |
-1.8% |
-3.1% |
-1.7% |
|
Waterbody |
-0.8% |
-0.8% |
-3.6% |
-4.5% |
-2.4% |
4.1 Future Population
The
exponential method offered lower population figures than graphical method
(Figure 3). While considering the lowest probable population, the model
predicted the possibility of the study area having around 24.3 million
inhabitants by the year 2025. Relevantly, it has been claimed that Dhaka city
might have 23.6 million (Parvin, 2013) to 25 million (Davis, 2006)
residents by 2025 which were close to the study’s projection. Thus, the study
considered forecasted population reliable and extended it to 2035, which
resulted in an estimated population of above 35 million for the study area by
that time.
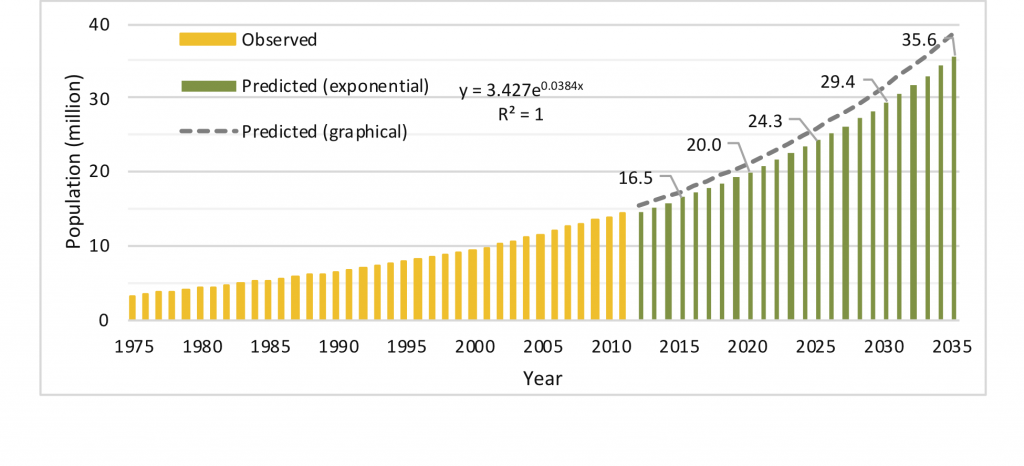
Figure 3: Observed and forecasted population of the study area
4.2 Imminent Land Cover Change
Using
liner regression model (see model summary in Appendix 1), core urban land
cover of the study area by 2035 was approximated to be around 977 km2i.e. nearly 68% of the study area (Figure
4). Waterbody (land cover) area was estimated, using its annual average loss
rate i.e. (-) 2.4% (see Table 2), to extend over only around 106 km2 (7%
of total) area. The remaining 25% (356 km2)
area was found likely to remain as potential urban space. In a related study,
Ahmed and Bramley (2015) concluded that, in the absence any spatial development
strategies, by 2025 more than 60% of total DMDP area would possibly be
urbanized. However, they also observed that restrictions on reserved land may
save around 15% from conversion into (core) urban land cover.
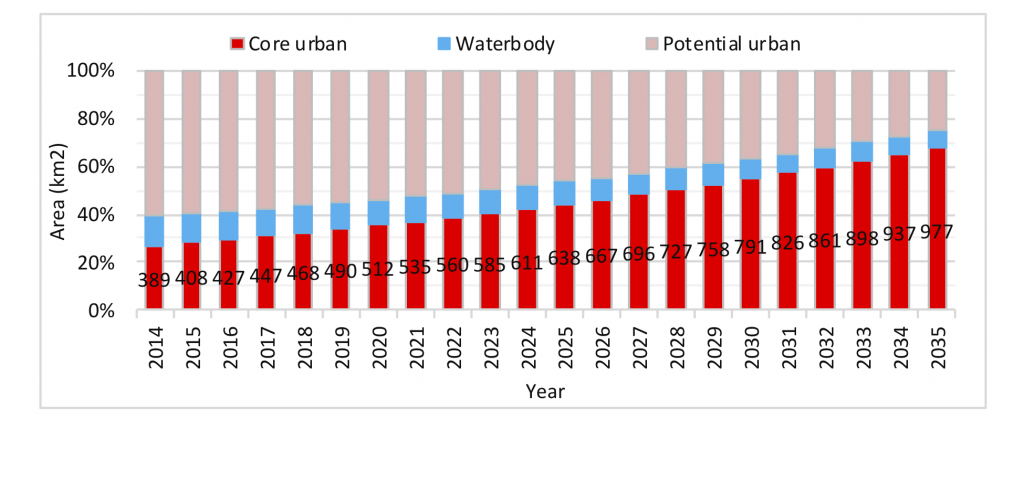
Figure
4: Predicted land cover scenario (using linear model) of the study area by 2035
4.3 Probable Temperature Change
The
Dickey-Fuller test, performed on collected temperature (1975-2015) records,
found the time series stationary (p = 0.0029). Hence, ACF and PACF of
temperature records were checked (Figure 5) to build an appropriate ARIMA
model. The ACF graph set a clear indication of moving average (MA) and the
model’s suitability for temperature change assessment. Therefore, this study
considered testing ARIMA(0,0,1) and MA(1
10) for
lags 1 and 10 models with constant (series mean). Additionally, looking
into the shape of PACF, an autoregressive AR(1
7 15) model
for significant lags 1, 7 and 15 with constant (series mean) was also rendered.
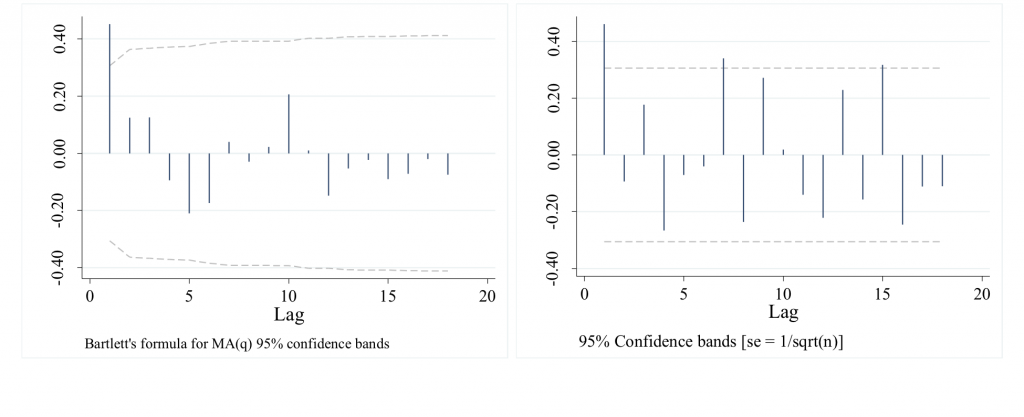
Figure
5: ACF and PACF graphs of collected mean maximum temperature data
It
was found that ARIMA(0,0,1) failed to pass probability test as its probability
(> chi2)
value was above acceptable 0.05 (Table 3) range. From the remaining tests, MA(1 10) model
was found to be the best fit for maintaining lower AIC and BIC values (Table
3). Later, the same MA(1 10) model (see model summary in Appendix 2)
was applied to forecast temperature to the year 2035 where the previously
predicted land covers were input as regressors. The resulting prediction
(Figure 6) showed that between 2016 and 2035 the study area is likely to
experience a nearly (+)1.52°C increase in mean maximum temperature compared to
the 1996-2015 period.
Table 3: Test result of
considered temperature (ARIMA) models
|
Summary |
Temperature (1975 – 2015) |
||
|
AR(1 7 15) |
ARIMA(0,0,1) |
MA(1 10) |
|
|
Number of observations |
41 |
||
|
Probability > chi2 |
0.0093 |
0.517 |
0.0001 |
|
AIC |
62.20853 |
55.44885 |
55.32161 |
|
BIC |
75.91711 |
64.01671 |
67.31661 |
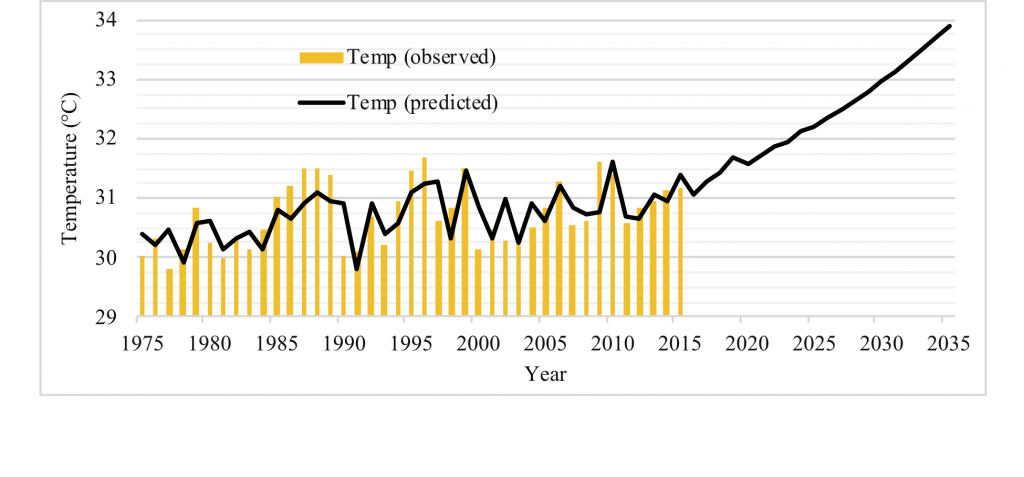
Figure
6: Observed and predicted temperature (using MA(1 10) model) of the study area
5.
Discussion
The
study area has exhibited a sharply increasing urbanization trend throughout the
examined period resulting in rapid land use and land cover change (LULCC).
During 1981-2011 period, population in the Dhaka Metropolitan Development Planning
(DMDP) area was found to be growing at an average annual rate of 3.84% as
opposed to the country’s overall rate of growth of 2.04% (World Bank, 2013)
rate. Dhaka’s population growth predominantly consists of migrants from rural
areas attracted by the advantages of urban life (Hossain, 2008; Islam,
1999; Alam & Rabbani, 2007). In line with the general predictions relating
to Dhaka city in respect of climate change vulnerabilities (UN-HABITAT, 2008;
Alam & Rabbani, 2007), the study has revealed predicted increases in mean
maximum temperature in the period 2016-2035. Such temperature rise may be the
consequence of global and regional environmental change as well as local land
cover change. To mitigate and adapt to the consequences of climate change or
natural disasters, it is important to foresee the probable scenario. This study
has communicated information relevant to such probable scenarios based on
future urban population, probable land cover changes, and associated
temperature (climate) change by 2035 for the DMDP area.
Considering
the study’s prediction, the expansion of core urban land cover in this area may
significantly increase the volume of surface runoff while retentions and water
channels (to retain and transfer rainwater to the surrounding outfalls
(rivers)) were being depleted or insufficiently maintained. During monsoon (May
to October), the level of surrounding rivers remains higher than the city’s
internal drainage level (Mowla & Islam, 2013). Consequently, the
drainage capacity of those rivers reduces, and the city faces severe
waterlogging from medium to high showers of rain. Over previous decades the
city authority replaced many canals and low-lying runoff channels with roads
and other infrastructure developments (Mowla & Islam, 2013). Moreover,
illegal encroachment by influential people has led to the disconnection of many
water drainage channels, drastically reducing their carrying capacity. Poor
management of surface drainage network exacerbates waterlogging which may lead
to flooding following prolonged rainfall.
In
the light of the study’s findings, it is apparent that urban (population)
growth management can contribute to minimizing temperature increases in Dhaka
city. Dhaka’s inexorable growth is the reflection of extreme centralization of
decision-making and political authority (Rahman, 2012). In this connection, ‘smart
growth’ principles
(Corrigan, et al., 2004) like limiting outward expansion, encouraging higher
density development, promoting mixed-use zoning, revitalizing older areas, etc.
can be adopted. This study revealed a comparatively higher population growth
rate in peripheral (fringe) areas characterized by sprawl development
patterns (Rahman, et al., 2008). Improved governance with strict control
and monitoring of the urban area plan, conservation and restoration of
protected lands, etc. can reduce loss of climate control sinks e.g. greeneries,
open space and waterbodies.
The
urban system is a complex mosaic of climate, land use, biophysical, and
socio-economic variables. In this study, land cover and climate change
prediction work at city scale examined historic observational data and applied
linear and time series model respectively. The study’s considered parameters
are very dynamic in nature and established models are not simple, precise, and
always mathematical. Moreover, temperature (climate) change prediction used
local parameters only where the impact of anticipated global/regional climate
change (IPCC, 2014) on the study area was overlooked. However, it is commonly
understood that the worst consequences of ongoing global climate change e.g.
extreme weather conditions, seaward hazards, etc. would be felt by low-lying
coastal cities like Dhaka (UNU-IHDP, 2015; UNFCCC, 2018). The study has
analyzed five datasets to assemble 1975-2015 land cover scenarios, this can be
improved by inputting more evidence from intermediate years. The observed
mean annual degradation rate of waterbodies has been used in predicting future
scenarios, which may vary in practice. Indeed, change in protected lands e.g.
waterbodies and public spaces may not follow the observed pattern as their
conservation greatly depends on the operational and management efficiency of
the local government/authorities.
Urbanization
is always accompanied by multiple changes in the socio-economic, cultural and
demographic setting (Khoury, 1982). The relationship between
socio-economic development and changes in land use that determines LULCC in
both urban and rural areas is dynamic (Long, et al., 2007). This study has
not evaluated social factors and their dynamics, investigation of these factors
would form a valuable focus for future research. Setting aside these
limitations, the predictions can still contribute in formulating development
guidelines that are responsive to climate change. Concerned city planners and
decision makers need to focus on managing the growth of both population and
core urban land cover for climate change management of the DMDP area. The
study’s implications can be employed to mitigate and minimize climate change
related negative externalities of Dhaka city notwithstanding any artificial or
natural interventions large enough to alter the observed pattern. As a final
point, this study may help to understand the underlying dynamism of similar
contexts, as well as to quantify the future degree/level of change in maximum
temperature for other urban areas.
Notes
[1] Land-use and land cover terms are often
used interchangeably. However, the underlying difference between those is
land-use stands for the particular use (e.g. residential / commercial etc.) of
land whereas the land cover means the surface cover (e.g. urban area/
vegetation etc.) on the ground (Coffey, 2013).
[2] Thana: administrative area/region in
urban area controlled by a police station
[3] Upazila: the sub-division of a District,
i.e. sub-district
[4] It is the long-term (20-year) strategic
planning document of the DMDP area, which provides urban development strategies
and planning proposals for the area.
[5] It is third and last tier of Development
Plan for DMDP area, which provides further detailed urban planning proposals
for specific sub-areas in the lights of the Structure Plan and the Urban Area
Plan.
Appendices
Appendix 1: Summary of core
urban land cover prediction model (linear regression)
|
Source |
SS |
df |
MS |
Number of obs = |
39 |
||
|
|
|
|
|
F(1,
37) = |
8463.87 |
||
|
Model |
407937.023 |
1 |
407937.023 |
Prob >
F = |
0 |
||
|
Residual |
1783.30564 |
37 |
48.1974497 |
R-squared = |
0.9956 |
||
|
|
|
|
|
Adj R-squared = |
0.9955 |
||
|
Total |
409720.329 |
38 |
10782.1139 |
Root
MSE = |
6.9424 |
||
|
Core urban |
Coef. |
Std. Err. |
t |
P>t |
[95% Conf. Interval] |
||
|
Population |
29.77811 |
0.3236775 |
92 |
0 |
29.12227 |
30.43394 |
|
|
_cons |
-84.8169 |
2.848425 |
-29.78 |
0 |
-90.58836 |
-79.04544 |
|
Appendix 2: Summary of MA(1 10) temperature
prediction model (time series)
|
Sample: 1975 – 2015 Log likelihood = -20.6608 |
Number of obs = |
41 |
||||
|
Wald chi2(5) = |
27 |
|||||
|
Prob > chi2 = |
0.0001 |
|||||
|
|
|
|
|
|
|
|
|
Temperature |
Coef. |
Std. Err. |
z |
P>z |
[95% Conf. Interval] |
|
|
Urban_linear |
0.0113777 |
0.031017 |
0.37 |
0.714 |
-0.0494146 |
0.07217 |
|
Potential_urban |
0.0059544 |
0.0379652 |
0.16 |
0.875 |
-0.0684559 |
0.0803648 |
|
Waterbody |
0.0111241 |
0.0295961 |
0.38 |
0.707 |
-0.0468833 |
0.0691314 |
|
_cons |
19.49265 |
49.57308 |
0.39 |
0.694 |
-77.6688 |
116.6541 |
|
ARMA ma |
||||||
|
L1. |
1.056285 |
0.2801433 |
3.77 |
0 |
0.5072141 |
1.605356 |
|
L10. |
0.1880118 |
0.1236563 |
1.52 |
0.128 |
-0.05435 |
0.4303736 |
|
/sigma |
0.3658156 |
0.0871539 |
4.2 |
0 |
0.1949971 |
0.5366341 |
References
Afrifa-Yamoah,
E., 2015. Application of arima models in forecasting monthly average surface
temperature of Brong Ahafo region of Ghana. International Journal of Statistics and Applications,
5(5), pp. 237-246.
Ahmed,
B. & Ahmed, R., 2012. Modeling urban land cover growth dynamics using multi
temporal satellite images: a case study of Dhaka, Bangladesh. ISPRS International Journal of Geo-Information,
1(1), pp. 3-31.
Ahmed,
B. et al., 2013. Simulating land cover changes and their impacts on land
surface temperature in Dhaka, Bangladesh. Remote Sensing, Volume 5, pp.5969-5998.
Ahmed,
S. & Bramley, G., 2015. How will Dhaka grow spatially in future?- modelling
its urban growth with a near-future planning scenario perspective. International Journal of Sustainable Built Environment,
4(2), pp. 359-377.
Alam,
M. & Rabbani, M. G., 2007. Vulnerabilities and responses to climate change
for Dhaka. Environment and Urbanization,
19(1), p. 81–97.
Aulakh,
R., 2013. Climate change forcing thousands in Bangladesh into slums of Dhaka.
[Online] Available at: http://www.thestar.com/news/world/2013/02/16/climate_change_forcing_thousands_in_bangladesh_into_slums_of_dhaka.html
[Accessed 14 May 2014].
Bairoch,
P. & Goertz, G., 1986. Factors of urbanisation in the nineteenth century
developed countries: a descriptive and econometric analysis. Urban Studies, Volume 23, pp. 285-305.
BBS,
1981. Community tables of dhaka
district, Gazipur District and Narayanganj District, Dhaka: Ministry of Planning.
BBS,
1991. Community series – Dhaka Zilla,
Gazipur Zilla and Narayanganj Zilla, Dhaka: Ministry of
Planning.
BBS,
2001. Community series – Dhaka Zilla,
Gazipur Zilla and Narayanganj Zilla, Dhaka: Ministry of
Planning.
BBS,
2012. Community report – Dhaka Zila,
Gazipur Zilla and Narayanganj Zilla, Dhaka: Ministry of
Planning.
Biswas,
S. K., Mahtab, S. B. & Rahman, M. M., 2010. Integrated water resources
management options for Dhaka City. Proceedings of International
Conference on Environmental Aspects of Bangladesh (ICEAB10),
Japan, Sept. 2010 Kitakyushu, Japan, pp. 179-181.
BMD,
2017. Bangladesh climate data portal.
[Online] Available at: http://bmd.wowspace.org/team/homex.php [Accessed 12
April 2017].
Bolund,
P. & Hunhammar, S., 1999. Ecosystem services in urban areas. Ecological Economics, Volume 29, pp. 293-301.
Climate
Future Group, 2006. Causes of climate change.
[Online] Available at:
www.climatefuture.org/menu/climate/causes/index.htm[Accessed 25 October 2019].
Coffey,
R., 2013. The difference between “land
use” and “land cover”. [Online] Available at:
http://msue.anr.msu.edu/news/the_difference_between_land_use_and_land_cover.
[Accessed 5 November 2013].
Corrigan,
M. B. et al., 2004. Ten principles for smart growth
on the suburban fringe, Washington, D.C.: ULI–the Urban Land
Institute.
Coskun,
H. G., Alganci, U. & Usta, G., 2008. Analysis of land use change and
urbanization in the Kucukcekmece Water Basin (Istanbul, Turkey) with temporal
satellite data using remote sensing and GIS. Sensors, Volume 8, pp. 7213-7223.
Dale,
V. H., 1997. The relationship between land-use change and climate change. Ecological Applications, 7(3), p. 753–769.
Davis,
M., 2006. Planet of slums.
London: Verso.
Dewan,
A. M. & Yamaguchi, Y., 2009a. Land use and land cover change in Greater
Dhaka, Bangladesh: using remote sensing to promote sustainable urbanization. Applied Geography, 29(3), pp. 390-401.
Dewan,
A. M. & Yamaguchi, Y., 2009b. Using remote sensing and GIS to detect and
monitor land use and land cover change in Dhaka Metropolitan of Bangladesh
during 1960–2005. Environmental Monitoring and
Assessment, Volume 150, pp. 237-249.
FHWA,
2001. Population forecasting methods:
a report on forecasting and estimating methods,
Washington, DC: Urban Planning Division, Bureau of Public Roads.
George,
M. V., Smith, S. K., Swanson, D. A. & Tayman, J., 2004. Population
projections. In: J. S. Siegel & D. A. Swanson, eds. The methods and materials of demography. 2nd ed. San Diego: Elsevier Academic
Press, pp. 561-602.
Gregorio,
A. D. & Jansen, L. J., 2005. Land cover classification
system – classification concepts and user manual. 2nd ed. Rome: Food and Agriculture
Organization (FAO).
Grimmond,
S., 2007. Urbanization and global environmental change: local effects of urban
warming. The Geographical Journal,
173(1), pp. 83-88.
Hong
Kong Observatory, 2012. Urbanization effect.
[Online] Available at: http://www.hko.gov.hk/climate_change/urbanization_e.htm
[Accessed 22 April 2013].
Hossain,
S., 2008. Rapid urban growth and poverty in dhaka city. Bangladesh e-Journal of Sociology,
5(1), pp. 1-24. [pdf] Available at: http://www.bangladeshsociology.org/BEJS%205.1%20Rapid%20Urban%20Growth%20and%20Poverty%20final.pdf?q=dhaka
[Accessed 1 March 2020]
IPCC,
2014. Climate change 2014: synthesis
report. Contribution of Working Groups I, II and III to the fifth assessment
report of the Intergovernmental Panel on Climate Change [Core Writing Team, R.K. Pachauri and
L.A. Meyer (eds.)]. Geneva, Switzerland: IPCC
Iqbal,
A. & Khan, M. H., 2005. Tall buildings in the urban
context of Dhaka City. New
York: Council on Tall Buildings and Urban Habitat, pp. 3-11.
Islam,
N., 1999. Urbanization, migration and
development in Bangladesh: recent trends and emerging issues,
Dhaka: Centre for Policy Dialogue.
Khan,
S., 2012. Arresting decline of a worst livable city. [Online] Available at:
http://www.thefinancialexpress-bd.com/more.php?date=2012-08-23&news_id=140750
[Accessed 2 November 2013].
Khoury,
N. F., 1982. Interrelationship
between urbanization and socio – economic changes in Syria, Beirut: population
and labour policies. Regional
Programme for the Middle East.
Long,
H., Heilig, G. K., Li, X. & Zhang, M., 2007. Socio-economic development and
land-use change: analysis of rural housing land transition in the transect of
the Yangtse River, China. Land Use Policy,
24(1) p.p.141–153.
Malaque,
R. I. & Yokohari, M., 2007. Urbanization process and the changing
agricultural landscape pattern in the urban fringe of Metro Manila,
Philippines. Environment and Urbanization,
19(1), pp. 191-206.
Meyer,
W. B. & Turner, B. L., 1992. Human population growth and global
land-use/cover change. Annual Review of Ecology and
Systematics, Volume 23, pp. 39-61.
Mowla,
Q. A. & Islam, M. S., 2013. Natural drainage system and water logging in
Dhaka: measures to address the problems. Journal of Bangladesh Institute
of Planners, Volume 6, pp. 23-33.
Naab,
F. Z. & Dogkubong, R., 2013. Urbanisation and its impact on agricultural
lands in growing cities in developing countries: a case study of Tamale in
Ghana. Modern Social Science Journal,
2(2), pp. 256 -287.
Parvin,
M., 2013. Projecting the population size of Dhaka city with migration using
growth rate method. IOSR Journal of Mathematics,
8(5), pp. 29-37.
Pielke,
R. A., 2005. Land use and climate change. Science, 310(5754), pp. 1625-1626.
Piwowar,
J. M. & Ledrew, E. F., 2002. ARMA time series modelling of remote sensing
imagery: a new approach for climate change studies. International Journal of Remote
Sensing, 23(24), pp. 5225-5248.
Prasad,
N. et al., 2009. Climate resilient cities, a
primer on reducing vulnerabilities to disasters.
Washington, DC: The World Bank.
Rahman,
G., Alam, D. & Islam, S., 2008. City growth with urban sprawl and problems
of management. Dalian: International Society
of City and Regional Planners (ISOCARP), pp. 1-11.
Rahman,
H. Z. ed., 2012. Bangladesh urban dynamics. Dhaka: Power and Participation Research
Centre (PPRC).
RAJUK,
1995. Dhaka metropolitan development
plan (1995-2015) volume – ii: urban area plan (1995-2005) , Dhaka: Dhaka Metropolitan Development
Planning (DMDP).
RAJUK,
2010. Preparation of detailed area
plan (dap) for Dhaka metropolitan development plan (dmdp) area,
Dhaka: Bangeladesh Govenment Press.
RAJUK,
2011. Detailed area plan – DAP.
[Online] Available at: http://www.rajukdhaka.gov.bd/rajuk/dapHome [Accessed 12
May 2013].
RAJUK,
2015. Dhaka structure plan 2016-2035
(final draft), Dhaka: Rajdhani Unnayan Kartripakkha (RAJUK).
Reis,
S., 2008. Analyzing land use/land cover changes using remote sensing and GIS in
Rize, North-East Turkey. Sensors,
Volume 8, pp. 6188-6202.
Romilly,
P., 2005. Time series modeling of global mean temperature for managerial
decision-making. Journal
of Environmental Management, 76(1), pp. 61-70.
Stojanov,
R., 2005. Environmental refugees between
development and poverty – case study of the Three Gorges Dam area.
Bonn, European Association of Development Research and Training Institutes
(EADI), pp. 1-19.
The
World Bank, 2012. Historical assessment of
spatial growth of the metropolitan areas of Delhi, Mumbai and Dhaka.
[Online] Available at: http://go.worldbank.org/5A2EGEFL90 [Accessed 6 April
2013].
Thomas,
S., 2008. Urbanization as a driver of change. The Arup Journal, 43(1), pp. 58-67.
Thompson,
J. R., Foster, D. R., Scheller, R. & Kittredge, D., 2011. The influence of
land use and climate change on forest biomass and composition in Massachusetts,
USA. Ecological Applications,
21(7), p. 2425–2444.
UN
DESA, 2019. World urbanization prospects
2018: highlights (ST/ESA/SER.A/421) , New York: Department of Economic and
Social Affairs, Population Division, United Nations.
UNFCCC,
2018. Global sea level rise is
accelerating – study. [Online] Available at:
https://unfccc.int/news/global-sea-level-rise-is-accelerating-study [Accessed
15 October 2019].
UN-HABITAT,
2008. State of the world’s cities
2008/2009, case study: Dhaka’s extreme vulnerability to climate change,
Nairobi: United Nations Human Settlements Programme (UN-HABITAT).
United
Nations, n.d. Climate change.
[Online] Available at:
https://www.un.org/en/sections/issues-depth/climate-change/ [Accessed 25
October 2019].
UNU-IHDP,
2015. Coastal zones and urbanization:
summary for decision-makers.Bonn: International Human
Dimensions Programme on Global Environmental Change (UNU-IHDP).
USGS,
n.d. EarthExplorer.
[Online] Available at: https://earthexplorer.usgs.gov/ [Accessed 3 June 2019].
WHO,
2000. Issue paper on: urban
environment management in Asia and the Pacific,
Hangzhou, Peoples Republic of China: Regional Office for Western Pacific of the
World Health Organization (WHO).
World
Bank, 2011. Historical assessment of
spatial growth of the metropolitan areas of Delhi, Mumbai and Dhaka. [Online] Available at:
http://go.worldbank.org/5A2EGEFL90 [Accessed 6 April 2013].
World
Bank, 2013. Data: Bangladesh. [Online] Available at:
http://data.worldbank.org/country/bangladesh [Accessed 7 March 2013].
World
Bank, 2018. World Bank staff estimates
based on the United Nations Population Division’s world urbanization prospects:
2018 revision. [Online] Available at: https://data.worldbank.org/ [Accessed
28 February 2019].
Xinhua,
2013. Dhaka suffers from over
population. [Online] Available at:
http://www.clickittefaq.com/in-the-news/dhaka-suffers-from-over-population/
[Accessed 22 October 2013].
Ye,
L., Yang, G., Ranst, E. V. & Tang, H., 2013. Time-series modeling and
prediction of global monthly absolute temperature for environmental decision
making. Advances in Atmospheric
Sciences, 30(2), pp. 382–396.