Measuring net environmental impact from
population growth and alternative energy
First online: 4 June 2020
Travis
D. Edwards: Department of Economics, University of Kansas, USA (travis.edwards@ku.edu)
Luis
Gautier: Department of Social Sciences, The University of Texas at Tyler, USA
–––––––––––––––––––––––––––––––––––––––––––
DOI: 10.3197/jps.2020.4.2.67
Licensing: This article is Open Access (CC BY 4.0).
How to Cite:
Edwards, T.D., and L. Gautier. 2016. 'Measuring net environmental impact from population growth and alternative energy'. The Journal of Population and Sustainability 4(2): 67–87.
https://doi.org/10.3197/jps.2020.4.2.67
–––––––––––––––––––––––––––––––––––––––––––
Abstract
Existing research on the relationship between economic growth and
environmental impact has produced mixed results. Also, there has been a
lack of attention on the effect of population, and per capita measures are used rather than total pollution. To
address this gap, we analyze the role of population and alternative energy on
the environment using total carbon dioxide emissions (CO2) in the United States. We
propose a new model integrating population demographics into the Environmental
Kuznets Curve, and then apply this framework to an empirical analysis. The
effect of population and immigration on total CO2 is estimated, as well as the
level of alternative energy use required to overcome increasing environmental
pressure. Results suggest population and immigration growth may lead to an
increase in total CO2 growth, but alternative energy
may lower total CO2 growth after a threshold.
Further, immigration and total CO2 growth exhibit a nonlinear
relationship.
JEL:
Q56; Q53; O13
Keywords:
environmental forecasting; environmental impact; green economics; population
growth; renewable energy.
1. Introduction
The
impact of population on environmental degradation is a comparatively
underexplored causal link in environmental economics. There is also an emphasis
on per capita pollution rather than total pollution e.g., carbon dioxide
emissions (CO2). We
have two main objectives in this note: (1) to propose a new model wherein the
Demographic Transition Model (DTM)[1]and
net migration, in conjunction with the I=PAT equation[2], are incorporated into the Environmental
Kuznets Curve (EKC), and (2) to investigate the effect of population,
immigration and technology on the environment through an empirical analysis of
total CO2 in the United States (US).
The
link between population and environmental degradation has been discussed as far
back as Malthus (1798).[3] More
recently, Ehrlich and Holdren (1971) introduced the concept of the I=PAT
equation to measure the environmental impact of economic activity in relation
to population, affluence, and technology.[4] Ehrlich
and Holdren (1971) argue that pressure from population growth has a
disproportionate effect on environmental degradation. Because of the expected
rise in population globally and the resulting pressure on resources via
demand/supply factors (e.g., Baldwin, 1995), along with flows of migration
becoming the main source of population growth in the near future (Vespa,
Armstrong, and Medina, 2018), looking at population in the context of environmental
degradation is relevant.
A
second widely-used approach to capture the link between environmental
degradation and economic activity is the EKC (Carson, 2010). The EKC was
developed based on the theory concerning the relationship between increasing
wealth in an economy and the corresponding environmental degradation of the
ecosystem (Stern, 2003). There is a large body of empirical work regarding the
EKC, yet no general consensus exists and few papers incorporate demographic
factors into their analyses.[5] Given the lack of consensus and growing
importance of population on environmental degradation, exploring the role of
population and migration in the context of the EKC is pertinent for the
formulation of policy.
Our
contribution is at the intersection of two branches of the literature. First,
demographic factors are often overlooked when analyzing possible environmental
impacts (e.g., Curran and Sherbinin 2004). However, there has been some recent
research incorporating demographic variables to better understand the relation
between population and the environment (e.g., Galeotti et al., 2011; Franklin
and Ruth, 2012; Roser, 2017). Our work is closest to Galeotti et al. (2011)
where they consider the demographic transition in a sample of countries and
find evidence for an “enriched” EKC.[6] We build on the work of Galeotti et al.
(2011) in three ways. First, we examine the role of immigration in explaining
total CO2 by estimating changes in total population
arising specifically from immigration and arguing that immigration may exert an
upward pressure
on CO2 growth. Second, we complement Galeotti et al. by developing a
model which incorporates the DTM into the EKC. Third, we show that the
relationship between immigration and the rate of the growth of total CO2 is
nonlinear, an analysis not present in Galeotti et al (2011), but with important
implications for policy formulation.
Our
second contribution to the literature rests on what has been a lack of
attention to total CO2, an
important area specifically absent from the EKC literature but with important
policy implications (e.g., determination of carbon budgeting and pricing
policies). An issue with past analyses is the almost universal use of per
capita emissions as the measure of pollution. Our main concern is the lack of
attention to total CO2,
since an increasing population may produce higher total CO2 even
as CO2 per capita declines.[7]However,
this is not to dismiss using per capita measures altogether. For example, Jones
and Warner (2016) used per capita measures to derive projections for future
energy demands and CO2 trajectories.
We
also examine the role of alternative energy (defined as energy that does not
produce carbon dioxide, including hydropower, geothermal, nuclear, wind, and
solar power, among others) in the population-environmental degradation nexus
and estimate a threshold level of alternative energy after which total CO2 may
fall. This is particularly important since alternative energy sources have
increased in recent years (U.S. Energy Information Administration, 2019) and so
identifying such a threshold can guide policy formulation.
Our
contribution also extends to the role of the DTM in the EKC by extending
demographic transition factors into the EKC and testing some of the results
using US data. Even though the US does not necessarily face over-population
issues vis-à-vis low-income countries, the US is considered as a case study
because it has arguably experienced all the phases present in the DTM and at
the same time the full range of income levels proposed in the EKC. An important
consideration, absent from the DTM, is concern for levels of net migration. Any
shift in lifestyle, related to ecological footprint, as migrants shift into
high-income countries may be relevant. Our results suggest that immigration may
play a role in explaining total CO2 growth. Additionally, the literature
suggests that the level of renewable energy usage and energy consumption
patterns in the economy are responsible for any possible mitigation of
pollution (e.g., Dogan and Ozturk, 2017; Soytas, Sari, and Ewing, 2007) and
therefore we explore the of alternative energy and migration on
total CO2 growth in the case of the US.
The
literature on the demographic transition argues that such transition is driven
by an increase in urbanization and industrialization, with potentially negative
effects on the environment. These effects range from the population age
structure and its implications on the demand for goods and services, to
migration patterns (Franklin and Ruth, 2012; United Nations, 2015). O’Neil et
al. (2012) consider demographic changes with regard to CO2by considering various household
characteristics such as age, size, and urban/rural data. O’Neill et al. (2012)
concluded aging populations have a lower overall environmental impact in
comparison to younger populations as a result of labor productivity. Also,
urbanization can lead to an increase in projected CO2 (O’Neil
et al., 2012; Weber and Sciubba, 2016). Conversely, Zhou and Liu (2016) argued
urbanization led to decreased levels of CO2 in China. Still, both Zhou and Liu (2016)
and O’Neill et al. (2012) found urbanization to decrease overall energy use.
Although results in the literature vary, all found population growth to have a
significant impact on CO2. And
although our results are consistent with the literature, our contribution
relies on the study of immigration and its impact on the environment.
The
literature also examines the rebound effect (e.g., Franklin and Ruth 2012;
Sorrell, Gatersleben, and Druckman, 2020; Madlener and Alcott, 2009; Baldini
and Jacobsen, 2016).[8] The
rebound effect, in which energy consumption increases as technology improves
efficiency, is estimated to be anywhere from 0% to 50% (Madlener and Alcott,
2009). However, Gilligan, Rapson, and Wagner (2016) make the case that even
though rebound effects exist, the overall gains from implementing
energy-efficient policy outweigh these effects. This result is consistent with
our estimates, but our analysis focuses on total CO2 rather
than per capita.
The
structure of this paper is as follows. Section two describes the US energy mix
and population structure. Sections three and four, respectively, introduce a
hypothesized model and describe the data. Sections five, six, and seven explain
the benchmark model, present an empirical analysis, and describe the robustness
check, respectively. Section eight concludes with a few remarks on policy
implications, limitations of the analysis, and future lines of research.
2. The US energy mix and
population structure
The
energy mix in the US is an important consideration since CO2 is
directly tied to the type of energy consumed. Currently, the US uses a mixture
of energy technologies including natural gas, crude oil, coal, nuclear, natural
gas plant liquids, biomass, hydroelectric, solar, wind, and geothermal. Of
these, petroleum comprises the largest share of total energy consumption, while
natural gas makes up the largest share when considering energy for electricity
generation (U.S. Energy Information Administration, 2019; BP Statistical
Review, 2019). Renewables such as hydroelectric, solar, wind, and geothermal
comprise the lowest four energy sources in terms of percentages, although their
use has continued to increase in recent years (U.S. Energy Information Administration,
2019). Nuclear energy increased each year from 1960 to 1990, but has leveled
off since 2000 (U.S. Energy Information Administration, 2019). The amount of
coal used for energy production has been on a steady decline, while the use of
natural gas and crude oil has been increasing (U.S. Energy Information
Administration, 2019; BP Statistical Review, 2019).
Since
our analysis focuses on alternative energy as a measure of technological
advancement, we pay particular attention to its usage. It should be noted that
alternative energy use can be broken into two distinct periods, 1960-1990 and
1990-2016, where different energy technologies played key roles in total CO2. Specifically, the increase in nuclear
energy use was prevalent for the 1960-1990 period, whereas increases in
renewable energy (e.g., solar, wind, geothermal) were significant for the
1990-2016 period (see figure 1).[9]
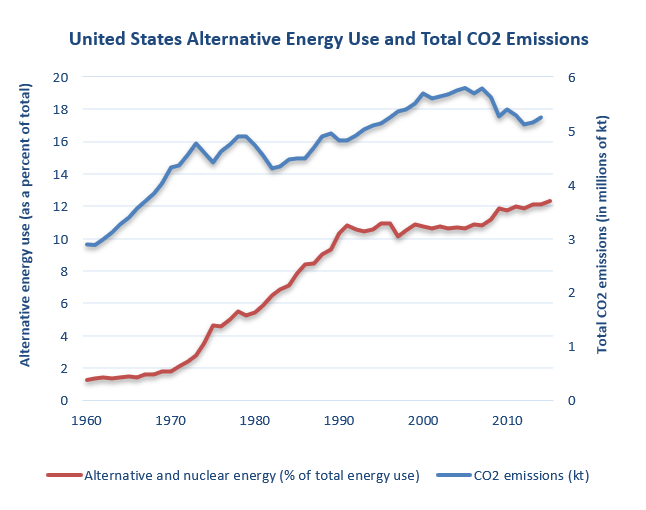
Figure 1
In
terms of policy, Jacobson et al. (2017) argue that 139 countries across the
world can achieve 80% conversion to zero-emitting energy, defined as energy
from wind, water, and sunlight (WWS), by 2030, and 100% zero-emitting energy by
2050. More specifically, Jacobson (2015) made the same case for each state in
the US. Considering that the level of alternative energy use in the US was only
approximately 12.3% as of 2015 (World Bank, 2018), Clark et al. (2017) warned
policymakers to remain cautious over plans which call for the use of WWS
exclusively and, instead, recommended a more balanced approach, which includes
a range of energy technologies in the economy.
Although
the US had a 11.5% increase in natural gas production in 2018, the use of
non-hydro renewable energy grew by 9.8% and coal production fell by 1.9% (BP
Statistical Review, 2019). Carbon emissions grew by 2.8%, while carbon
intensity continued declining at a rate of 0.9% (BP Statistical Review, 2019). Further,
energy consumption grew by 3.5% (BP Statistical Review, 2019). These figures
suggest that the US is seeing improvements in the use of renewable energy, but
as the demand for energy increases natural gas and coal remain as the primary
sources of energy for electricity generation.
Galeotti
et al. (2011) argue that for long-term environmental sustainability, both
economic growth and policy for lowering population are needed. The increased
global total CO2 resulting from cross-country migration is
a major concern (Cafaro and Staples, 2009). At the same time Cafaro and Götmark
(2019) show, in the case of the European Union, that minor changes in annual
net migration can lead to large changes in future population. And in the case
of the US, immigration has become the main driver of population growth (Cafaro
and Staples, 2009). Although fertility rates in the US are below the
replacement rate of 2.1 births per woman, the increase from positive net
migration has a larger impact on population than this decline in fertility
(figure 2) (World Bank, 2018). Therefore, the US population is projected to
increase for the foreseeable future. The implication is that even if CO2 per
capita is declining a net increase in total CO2 may
be expected as each additional person contributes to the sum.
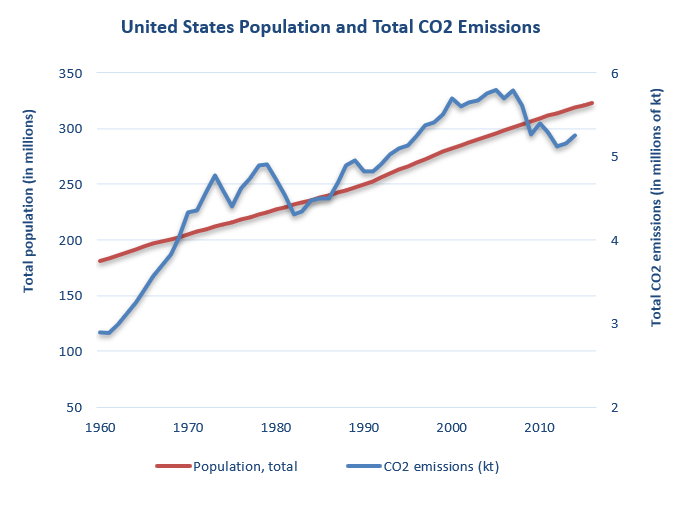
Figure 2
3. A Model
Figure
3 illustrates an overview of the relationship between the demographic
transition and the I=PAT equation from the standard theory, factoring in net
migration levels (positive for the US). The arrows in front of the variable
signal the effect on environmental impact, I, not the rate of increase in the
variable itself. For example, an increase in technology, T, has an upward
pressure on environmental impact, I, during phase one of the demographic
transition, but an increase in technology, T, has downward pressure on
environmental impact, I, during phase three of the transition process.
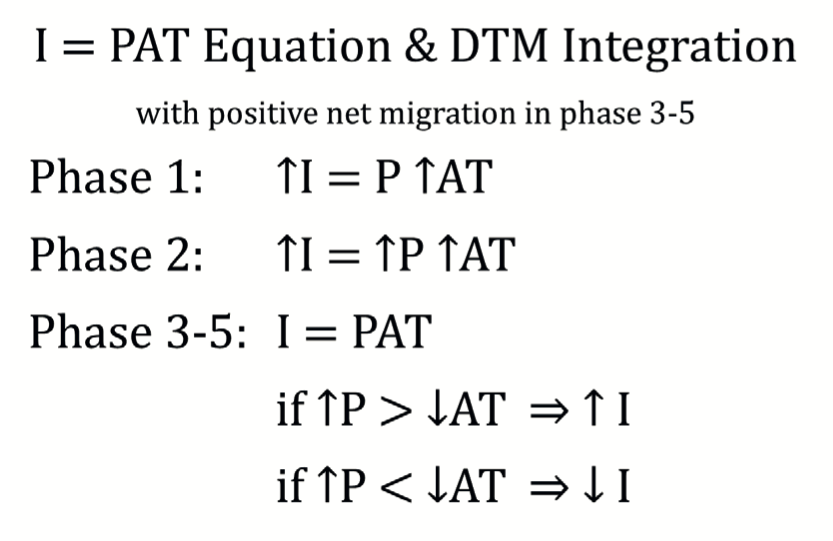
Figure 3
Figure
4 presents a preliminary integration of the I=PAT equation and DTM into the
EKC, including net migration. This model illustrates environmental impact from
population, affluence, and technology through the five stages of the
demographic transition. A key point to this proposed model is the consideration
of positive net migration as advanced economies have significantly larger
levels of energy/goods consumption. Although the demographic transition will
drive down population growth as an economy develops, and thus environmental impact,
immigration may offset this decline as overall population in developed
countries continues to grow. An empirical analysis of this hypothesis follows.
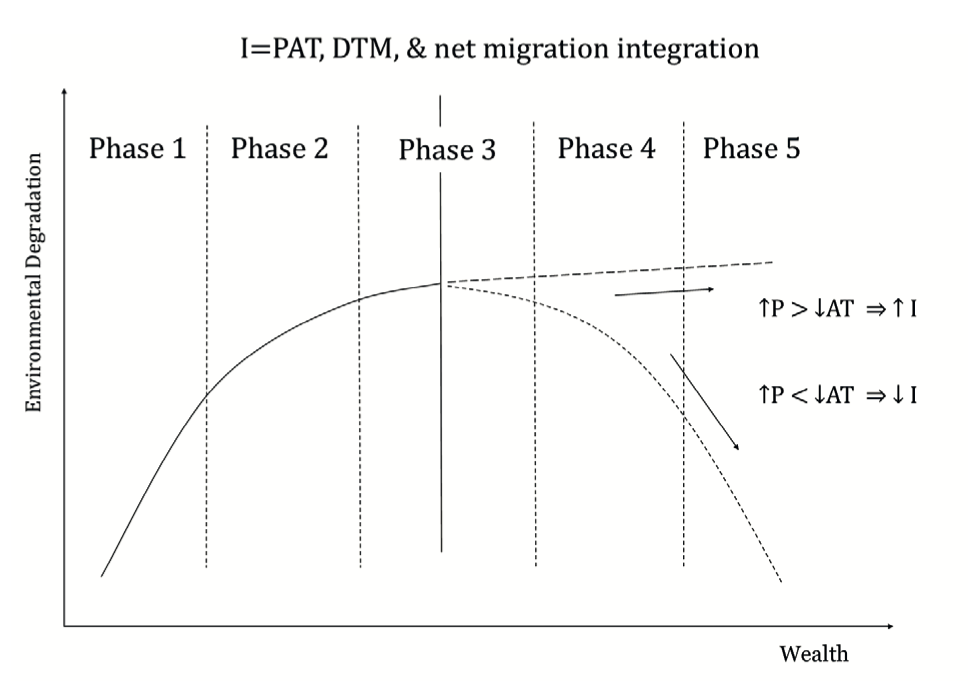
Figure 4
4. Data
Annual
data for the US from years 1960-2016 was obtained from the World Bank. We use
total CO2 (total emissions in kt) as the measure of
environmental impact, total population, and real GDP as a control to capture
changes in economic activity. Time dummies were constructed to capture
period-specific effects such as recessionary periods and global oil shocks.
Alternative energy, as a percent of total energy use, is used as a measure for
technological advancement to capture increasing technology in an economy while
avoiding high correlation with population. As noted earlier, this will
incorporate the effects of all near-zero-emissions energy use from 1960-2016.
In
addition to population we look at the role of immigration. Even though there is
total immigration data available for the US, we focus on cumulative immigration
instead. The reason for this is threefold. First, total immigration is measured
on an annual basis and thus represents a relatively small share of total
population: the US population is over 326 million and approximately 41 million
have immigrated since 1960, while total immigration has averaged 722 thousand
annually (World Bank, 2018). As a result, any changes in CO2 explained
by immigration are likely to be offset by the variability explained by total
population. Second, cumulative immigration is defined as immigration at time t,
plus all previous immigration from 1960. Thus, cumulative immigration arguably
captures the potential cumulative effects of immigration on CO2 while
accounting for changes in consumption behavior once migrants settle in the US.
Third, net migration growth (net migration defined as either total population
minus total immigration or total population minus total cumulative immigration)
mirrors total population growth over time and exhibits a Pearson correlation
coefficient of just over 0.92.
To
test for stationarity we rely on Dickey-Fuller and Phillips-Perron tests, where
total CO2,
total population, alternative energy and real GDP are I(1), whereas cumulative
immigration is I(0).
5. Benchmark Model Specification
We
estimate the following benchmark model in first differences using Ordinary
Least Squares (OLS):
(1)
![]()
where d(lnCO2totalt)
denotes the first-differenced natural log of total CO2 (in
kt) at time t, d(lnPOPt ) first-differenced natural
log of total population at time t, d(lnALNt) first-differenced natural log of
alternative energy use at time t, and εt the residuals. We model
residuals following an autoregressive–moving-average (ARMA) structure when
applicable.[10] The
term Z in (1) denotes a set of controls such as
the one-period lagged first-differenced natural log of real GDP (constant
2010 USD), a linear time trend and time-specific dummies to capture, for
example, recessionary periods in the US.
It is
noteworthy that real GDP is arguably correlated with population and CO2. As a result, alternative energy is used
to avoid issues of correlation with population, but also the one-period lag for
real GDP was used to avoid issues of endogeneity. In any case, Pearson
correlation coefficients do not suggest a high degree of correlation between
real GDP, alternative energy, total population and cumulative immigration.
6. Results
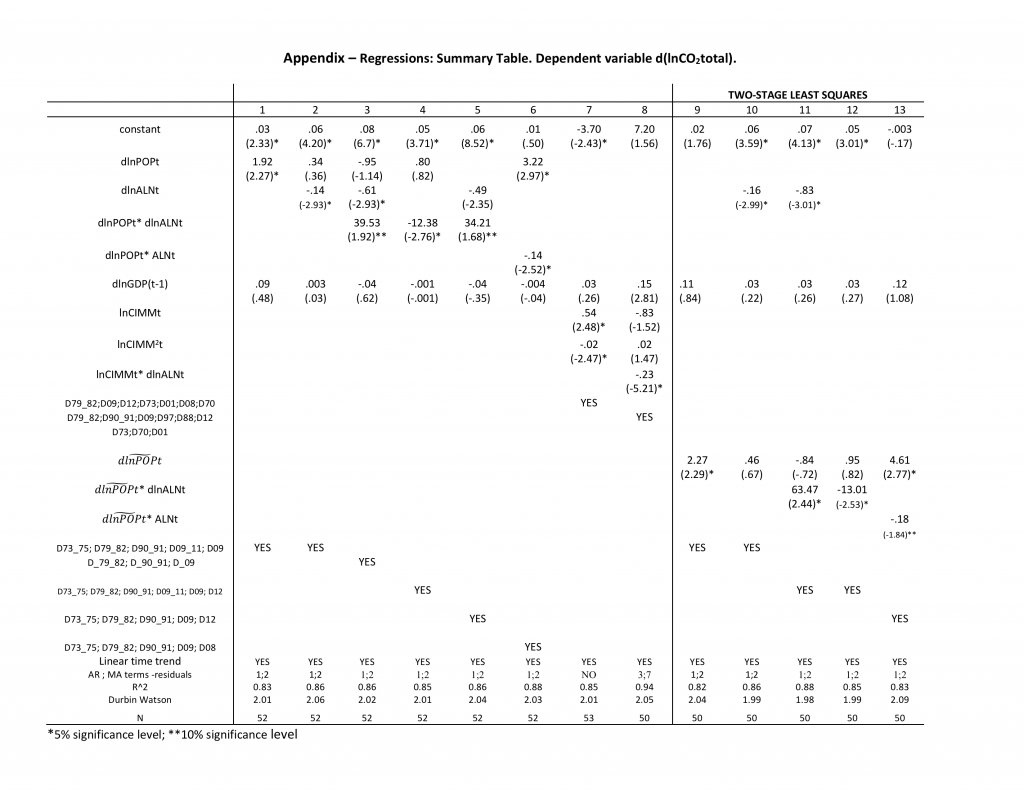
Estimation
of (1) suggests that higher growth rates of population imply higher growth
rates of total CO2. The
estimated coefficient, β1, is positive and statistically
significant, implying a 1 percentage point increase in the growth rate of
population results in an approximately 1.92 percentage point increase in
total CO2 growth (see summary table in the
appendix). The alternative energy coefficient, β2, is
negative and statistically significant, which implies that increasing the rate
of growth of alternative energy use by 1 percentage point results in an
approximately 0.15 percentage point decrease in total CO2 growth.
Estimates also suggest that the inclusion of alternative energy into the model
may reduce the upward pressure population has on CO2, thereby pointing to the key role of
alternative energy in explaining variations in CO2.
To
explore the potential interaction between population and alternative energy, a
second model specification is considered:
(2)
![]()
Estimation
of (2) points to two important results. First, population may have a larger
increasing effect (i.e. increase in the growth rate of CO2) vis-à-vis the decreasing effect (i.e.,
decrease in the growth rate of CO2) of
alternative energy use on the growth rate of total CO2. This indicates that although CO2per capita is in decline (figure 5), the
effect of population can be larger so there is a net increase in total CO2 (figure
6). This increase is consistent with our hypothesized EKC (figure 4). Second,
the model suggests that the growth rate in the share of alternative energy
required to achieve the turning point predicted in the EKC is approximately 23%.[11] As of
2015, the level of alternative energy use in the US was 12.3% (World Bank,
2018). This indicates that total CO2 growth may continue rising until
alternative energy use is expanded. It is noteworthy that we were also able to
identify such a result for the 1990-2016 period, where the population growth
rate in the US shows a clear downward trend, but also a fairly stable use of
alternative energy, particularly in renewables.
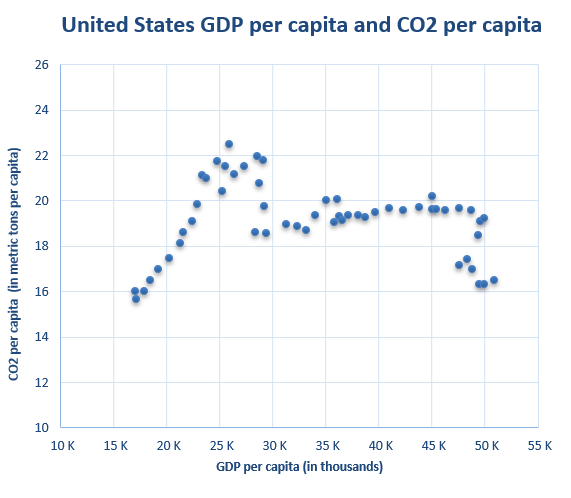
Figure 5
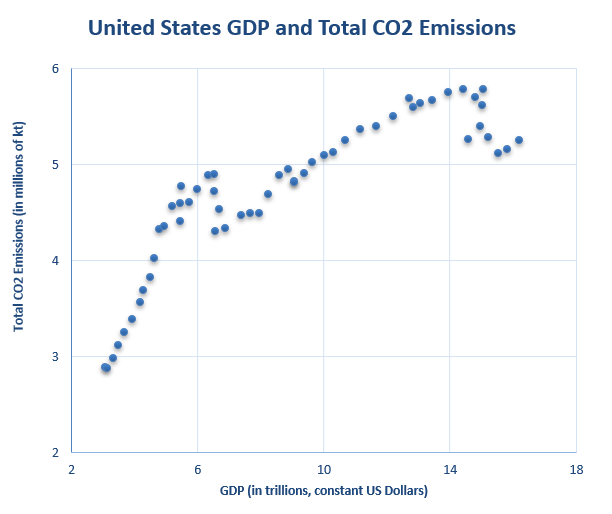
Figure 6
A
third model is estimated to analyze the effect of cumulative immigration on
total CO2:
(3)
![]()
where lnCIMMt denotes
the natural log of cumulative migration at time t. Results indicate (i) a nonlinear inverted-U relationship
between cumulative immigration and the growth rate of total CO2, and (ii) alternative energy, consistent
with (1), puts a downward pressure on the growth rate of total CO2. These results are important because
immigration will become the main source of population growth by the year 2030
as the natural rise from population momentum begins to slow (Vespa et al.,
2018).
The
non-linear relationship between cumulative immigration and growth in
total CO2 growth indicates that the growth in
cumulative migration can have an upward pressure on CO2 if
cumulative migration remains on average just under 1.5 million a year. Since
this threshold has been exceeded, the analysis suggests that the growth rate of
total CO2 may likely slowdown via immigration.
7. Robustness Check
We
employ a two-stage least squares estimation technique with the dual purpose of
addressing potential issues of endogeneity between population and CO2, but also account for variations in
population arising specifically from immigration. Results from previous
sections hold indicating that (i) population growth explained by growth in
immigration may exert an upward pressure on total CO2 growth,
and (ii) there is an alternative energy use threshold level after which
total CO2 growth falls. The result in (i) suggests
that variations in immigration play a role in explaining total CO2growth and thus should be kept in mind
when formulating policy, albeit the effects on the level of total CO2 are
likely relatively small given the small share of immigration with respect to
total population in the US.
The
two-stage least squares estimation consists of first estimating population
growth as follows:
(4)
![]()
where d(lnPOPt)
denotes the growth rate of immigration, and ∆ a set time dummies and linear and
non-linear time trends. The specification in (4) considers one-period time lags
to avoid issues of endogeneity since total population incorporates immigration
in its measurement. On the second stage, the estimated growth in total population
obtained from (4) –![]() – is used to re-estimate (1) and
(2). Results are shown in the Appendix.
– is used to re-estimate (1) and
(2). Results are shown in the Appendix.
8. Conclusion and Policy
Implications
After
controlling for economy-wide and time-specific effects, estimates suggest
evidence against an inverted-U EKC for total CO2 growth
in the US. Population growth increases total CO2 growth,
which may surpass the downward pressure from increased technology measured
through alternative energy. This result indicates that although CO2 per
capita is in decline, the effect of population is greater, thus leading to a
net increase in total CO2.
Results also point to a threshold level of alternative energy growth after
which growth in total CO2 may fall.
While
we provide some evidence that total CO2 is increasing as a result of population
growth, there are areas which need further consideration. First, expanding the
analysis to include the effect of population on pollution apart from CO2 (e.g.,
NOx)
would be an improvement, particularly if connections to the energy sector are
sought. Second, broadening the analysis to include a range of countries in
various stages of the demographic transition, while increasing the number of
observations, would help in understanding the effect of population as an
economy develops. Third, the analysis considers total CO2, not total consumption-based CO2. Thus, checking whether results hold
using total consumption-based CO2 would give a better sense as to whether
immigration is having a significant effect on total CO2. In this sense our results should be
taken with caution.
While
our research focuses on alternative energy sources, recent trends are moving
away from nuclear energy and towards renewable energy sources. We should note
that renewable energy use has increased, reaching record highs in 2019 (U.S.
Energy Information Administration, 2019). Also, alternative energy was chosen
for the measure of technology to avoid high correlation with population, but
the relation to CO2 should be noted. There is the concern
thatCO2 affects
the level of alternative energy in a country, which would need further
investigation to rule out issues of endogeneity (i.e., is increasing renewable
energy use driving down CO2, or
is increasing CO2 causing faster implementation of
renewable energy?). Exploring other measures of technology and comparing
results would be worthwhile as robustness checks.
Improving
our understanding of the impact of human population and economic growth on the
environment is invaluable for policymakers. This is equally important for both
economically advanced and developing regions. The ability to collectively lower
our environmental impact in both advanced and developing economies is vital to
the future of the planet. Implementing effective environmental and economic
policies which can be strategically enacted for specific stages of development,
to reduce overall environmental degradation while maintaining an acceptable
standard of living, is crucial to this task.
Notes
[1] The
Demographic Transition Model explains the shift in population structure during
five phases: high death rates/high birth rates; falling death rates/high birth
rates; low death rates/falling birth rates; low death rates/low birth rates;
low death rates/stable birth rates near the replacement rate (Roser, 2017).
[2] I=PAT
stands for Environmental Impact = Population X Affluence X Technology
[3]Other early contributions include David
Ricardo’s theory on land rent, Arthur Pigou’s work on tax policy to improve
resource allocation, and Nicolas de Condorcet’s proposal that air pollution was
a negative externality from economic activity (Sandmo 2015).
[4] Perhaps
the most robust application of the I=PAT equation is the extended formulation
by Dietz, Rosa, and York (2003) known as the STIRPAT project. The STIRPAT
project assessed environmental impact with the I=PAT equation, using stochastic
estimation through regression analysis, while converting the variables to
natural logarithms and placing T as an error term (by arguing there is not an
appropriately agreed-upon measurement for this variable) (Dietz, Rosa, and
York, 2003). The study concluded that modernization leads to an overall
negative impact on environmental degradation, with no evidence to support the
widely held belief that economic growth eventually leads to declining environmental
impact, such as predicted by the EKC (Dietz, Rosa, and York, 2003).
[5] e.g.,
Atasoy, 2017; Carson et al., 1997; Franklin and Ruth, 2012; Grossman and
Krueger 1995; Holt-et al., 1992; List and Gallet, 1999; Meadows et al. 1972;
Mitchell 2012; Rupasingha et al., 2004; Shafik and Bandyopadhya 1992; York et
al., 2003
[6] Baldwin
(1995) points to the implications arising from demographic factors and argues
that in order to reach environmental sustainability the majority of the world
must move past the second phase of the demographic transition, while moving as
quickly as possible through the ecological transition. Galeotti et al. (2011)
builds on Baldwin (1995) using CO2 data
for 17 Organisation for Economic Co-operation and Development (OECD) countries.
[7] A
notable exception is Franklin and Ruth (2012), who argued that although CO2 per capita has leveled out in recent
years, total CO2continues to increase.
[8] Rebound
effects were first hypothesized by Jevons (1866) regarding improvements in the
efficiency of coal use in steam engines leading to their expansion.
[9] The
models presented in this paper were also formulated with nuclear and renewable
energy as separate variables during these two time periods, each being
statistically significant for each respective period.
[10] Residual
diagnostics rely on partial correlation and autocorrelation functions,
Durbin-Watson statistic and Q-statistic.
[11] The
approximation for the level of alternative energy use required, as a percent of
total, is obtained from β1 + γ2ALNt in summary table, column 6.
References
Atasoy,
B., 2017. Testing the environmental Kuznets curve hypothesis across the U.S.:
evidence from panel mean group estimators. Renewable and Sustainable Energy Reviews. 77,
pp.731-47.
Baldini,
M. and Jacobsen, H.K., 2016. Optimal trade-offs between energy efficiency
improvements and additional renewable energy supply: a review of international
experiences. In: Institute of Electrical and Electronics Engineers, 2016 13th
International Conference on the European Energy Market (EEM). Porto, Portugal ,
6-9 June 2016. New York, NY: IEEE.
Baldwin,
R., 1995. Does sustainability require growth?. In: I. Golden and L.A. Winters
eds. The Economics of Sustainable
Development. Cambridge:
Cambridge University Press. pp.51-78.
Beckerman,
W., 1992. Economic growth and the environment: Whose growth? whose
environment?. World Development.
20(4), 1992, pp.481-96.
BP,
2019. Statistical Review-2019-The US
energy market in 2018. [pdf] London: British Petroleum Co.
Available at: https://www.bp.com/content/dam/bp/business-sites/en/global/corporate/pdfs/energy-economics/statistical-review/bp-stats-review-2019-us-insights.pdf [Accessed 20 February 2020].
Cafaro,
P. and Gotmark, G., 2019. The potential environmental impacts of EU immigration
policy: future population numbers, greenhouse gas emissions and biodiversity
preservation. The Journal of Population and Sustainability. 4(1), pp.71-101.
Cafaro,
P. and Staples, W., 2009. The environmental argument for reducing immigration
into the United States. Environmental
Ethics. 31(1), pp.5-30.
Carson,
R., 2010. The Environmental Kuznets Curve: Seeking empirical regularity and
theoretical structure. Review of Environmental
Economics and Policy. 4(1),
pp.3-23.
Carson,
R., Jeon, Y. and McCubbin, D., 1997. The relationship between air pollution
emissions and income: US Data. Environment and Development
Economics. 2(4),
pp.433-50.
Casey,
G. and Galor, O., 2017. Is faster economic growth compatible with reductions in
carbon emissions? The role of diminished population growth. Environmental Research Letters. 12, doi:10.1088/1748-9326/12/1/014003.
Caviglia-Harrisa,
J., Chambersa, D. and Kahn, J., 2009. Taking the “U” out of Kuznets: a
comprehensive analysis of the EKC and environmental degradation. Ecological Economics. 68(4), pp.1149-59.
Chowdhury,
R. and Moran, E., 2012. Turning the curve: a critical review of the Kuznets
approaches. Applied Geography. 32(1), pp.3-11.
Clack,
C., Qvist, S., Apt, J., Bazilian, M., Brandt, A., Caldeira, K., Davis, S.,
Diakov, V., Handschy, M., Hines, P., Jaramillo, P., Kammen, D., Long, J.,
Granger M., Morgan, Reed, A., Sivaram, V., Sweeney, J., Tynan, G., Victor, D.,
Weyant, J. and Whitacre J., 2017. Evaluation of 100% wind, water, and solar
power. Proceedings of the National
Academy of Sciences. 114(26), pp.6722-27.
Curran,
S. and Sherbinin, A., 2004. Completing the picture: the challenges of bringing
“consumption” into the population-environment equation. Population and Environment.
26(2), pp.107-31.
Dogan,
E. and Ozturk, I., 2017. The influence of renewable and non-renewable energy
consumption and real income on CO2 emissions
in the USA: evidence from structural break tests. Environmental Science and Pollution Research International. 24(11), doi:10.1007/s11356-017-8786-y.
Ehrlich,
P.R. and Holdren, J.P., 1971. Impact of population growth. Science, New Series. 171(3977), pp.1212-17.
Figge,
F., Young, W. and Barkemeyer, R., 2014. Sufficiency or efficiency to achieve
lower resource consumption and emissions? The role of the rebound effect. Journal of Cleaner Production. 69, pp.216-24.
Franklin,
R.S. and Ruth, M., 2012. Growing up and cleaning up: the environmental Kuznets
curve redux. Applied Geography. 32, pp.29-39.
Galeotti,
M., Lanza, A. and Piccoli, M.C.L., 2011. The demographic transition and the ecological transition: Enriching the Environmental Kuznets
Curve. IEFE
Working Paper No. 44. [online] Available at: https://papers.ssrn.com/sol3/papers.cfm?abstract_id=1922594 [Accessed 10 October 2019].
Gillingham,
K., Rapson D. and Wagner, G., 2016. The rebound effect and energy efficiency
policy. Review of Environmental
Economics and Policy. 10(1), pp.68-88.
Grossman,
G.M. and Krueger, A.B., 1991. Environmental impacts of a North
American Free Trade Agreement. National Bureau of Economic
Research Working Paper No. 3914. [online] Available at: https://www.nber.org/papers/w3914 [Accessed 10 October 2019].
Grossman,
G.M. and Krueger, A.B., 1995. Economic growth and the environment. The Quarterly Journal of Economics. 110(2), pp.353-77.
Holtz-Eakin,
D. and Selden, T., 1992. Stoking the fires? CO2 emissions and economic growth. National Bureau of Economic Research
Working Paper No. 4248. [online] Available at: https://www.nber.org/papers/w4248 [Accessed 10 October 2019].
Jacobson,
M., Delucchi, M., Bauer, Z., Goodman, S., Chapman, W., Cameron, M., Bozonnat,
C., Chobadi, L., Clonts, H., Enevoldsen, P., Erwin, J., Fobi, S., Goldstrom,
O., Hennessy, E., Liu, J., Lo, J., Meyer, C., Morris, S., Moy, K., O’Neill, P.,
Petkov, I., Redfern, S., Schucker, R., Sontag, M., Wang, J., Weiner, E. and
Yachanin, A., 2017. 100% clean and renewable wind, water, and sunlight
all-sector energy roadmaps for 139 countries of the world. Joule. 1(1), pp.108-21.
Jacobson,
M., Delucchi, M., Bazouin, G., Bauer, Z., Heavey, C., Fisher, E., Morris S.,
Piekutowski, D., Vencill, T. and Yeskoo, T., 2015. 100% clean and renewable
wind, water, and sunlight (WWS) all-sector energy roadmaps for the 50 United
States. Energy Environmental Science. 8, doi.org/10.1039/C5EE01283J.
Jevons,
W.S., 1866. The Coal Question. 2nd ed. London: Macmillan.
Jones,
G. and Warner, K., 2016. The 21st century population-energy-climate nexus. Energy Policy. 93,
pp.206-12.
Kuznets,
S., 1955. Economic growth and income inequality. The American Economic Review. 45(1),
pp.1-28.
List,
J. and Gallet, C., 1999. The environmental Kuznets curve: Does one size fit
all?. Ecological Economics. 31(3), pp.409-23.
Madlener,
R. and Alcott, B., 2009. Energy rebound and economic growth: a review of the
main issues and research needs. Energy. 34(3),
pp.370-76.
Malthus,
T., 1798. An essay on the principle of population. Reprint, 2nd ed., 1992.
Edited with an introduction by Donald Winch. Cambridge: Cambridge University
Press.
Meadows,
D.H., Meadows, D.L., Randers, J. and Behrens III, W., 1972. The limits to growth. New York: Universe Books.
Mitchell,
R., 2012. Technology is not enough: climate change, population, affluence, and
consumption. The Journal of Environment and
Development. 21(1), pp.24–27.
O’Neill,
B.C., Liddle, B., Jiang, L., Smith, K.R., Pachauri, S., Dalton, M. and Fuchs,
R., 2012. Demographic change and carbon dioxide emissions. The Lancet. 380(9837), pp.157-64.
Roser,
M., Ritchie, H. and Ortiz-Ospina, E., 2019. World Population Growth., 2019. Our World in Data. [online]
Available at: https://ourworldindata.org/world-population-growth [Accessed 10 October 2019].
Rupasingha,
A., Coetz, S., Debertin, D. and Pagoulatos, A., 2004. The environmental Kuznets
curve for US counties: A spatial econometric analysis with extensions. Papers in Regional Science. 83(2), pp.407-24.
Sandmo,
A., 2015. The early history of environmental economics. Review ofEnvironmental Economics and Policy. 9(1), pp.43–63.
Shafik,
N. and Bandyopadhya, S., 1992. Economic growth and
environmental quality: Time-series and cross-country evidence. The World Bank Policy Research Working Paper Number 904. [online] Available at: https://ideas.repec.org/p/wbk/wbrwps/904.html [Accessed 10 October 2019].
Sorrell,
S., Gatersleben, B. and Druckman, A., 2020. The limits of energy sufficiency: A
review of the evidence for rebound effects and negative spillovers from
behavioural change. Energy Research & Social
Science. 64, doi.org/10.1016/j.erss.2020.101439.
Soytas,
U., Sari, R. and Ewing, B., 2007. Energy consumption, income, and carbon
emissions in the United States. Ecological Economics. 62, (3–4), pp.482-89.
Stern,
D., 2003. The Environmental Kuznets
Curve. [pdf]
Internet Encyclopaedia of Ecological Economics. International Society for
Ecological Economics. Available at: https://www.researchgate.net/profile/David_Stern/publication/237780646_International_Society_for_Ecological_Economics_Internet_Encyclopaedia_of_Ecological_Economics/links/0deec52743a9796717000000/International-Society-for-Ecological-Economics-Internet-Encyclopaedia-of-Ecological-Economics.pdf [Accessed 10 October 2019].
The
World Bank, 2018. World Development Indicators,
United States. [online] Available at: https://data.worldbank.org/country/united-states?view=chart[Accessed
10 October 2019].
United
Nations, 2015. International Migration
Report. [pdf]
New York: United Nations Department of Economic and Social Affairs. Available
at: https://www.un.org/en/development/desa/population/migration/publications/migrationreport/docs/MigrationReport2015_Highlights.pdf [Accessed 10 October 2019].
U.S.
Energy Information Administration, 2019. Energy Facts. [online] Washington D.C.: U.S. Energy
Information Administration. Available at: https://www.eia.gov/energyexplained/us-energy-facts/ [Accessed 20 February 2020].
Vespa,
J., Armstrong, D. and Medina, L., 2018. Demographic Turning Points for the United States: Population
Projections for 2020 to 2060. [pdf]
Washington D.C.: United States Census Bureau. Available at: https://www.census.gov/content/dam/Census/library/publications/2018/demo/P25_1144.pdf [Accessed 10 October 2019].
York,
R., Rosa, E. and Dietz, T., 2003. A rift in modernity? Assessing the
anthropogenic sources of global climate change with the STIRPAT model. International Journal of Sociology and Social Policy. 23(10),
pp.31-51.
Weber,
H. and Sciubba, J.D., 2018. The Effect of Population Growth on the Environment:
Evidence from European Regions. European
Journal of population. 35(2),
pp.379–402.
Zhou,
Y. and Liu, Y., 2016. Does population have a larger impact on carbon dioxide
emissions than income? Evidence from a cross-regional panel analysis in China. Applied Energy. 180, pp.800-09.