| 10.3197/JPS.2021.5.2.17 | Open Access - CC BY 4.0 |
A Wager on Global Food Prices 2001–2020: Who Won and What Does it Mean?
Stan Becker, Johns Hopkins University1
David Lam, University of Michigan2
Abstract
This paper presents the results of a 2011 wager between Stan Becker and David Lam about the trajectory of world food prices for the period 2011–2020 versus the period 2002–2010. The wager was a response to Lam’s 2011 presidential address to the Population Association of America, which showed that many health and socio-demographic indicators had improved over the previous fifty years, in spite of the addition of four billion people to the world’s population. Lam lost the wager, with the Food and Agriculture Organization’s price index for five food groups averaging about twenty per cent higher for 2011–2020 than for 2001–2010. Becker and Lam discuss the background of the wager, give their differing interpretations of the outcome and discuss future trends in population, food production and food prices. Lam gives a more optimistic perspective on future trends, while Becker raises concerns about rapid degradation of planetary ecosystems, species loss and global warming.
Keywords: food prices; population; wager; economics; ecology
Introduction
Predicting the future is always risky. Food prices are a case in point. David Lam, an economist and President of the Population Association of America in 2011, in his presidential address showed that many health and socio-demographic indicators had improved over the previous fifty years despite the dire predictions of neo-Malthusian Paul Ehrlich (Lam, 2011). He reviewed the bet between Paul Ehrlich and Julian Simon, an economist, regarding the trend in prices of five metals over the decade 1980–1990. Ehrlich lost the bet. Lam then challenged anyone in the audience who might want to wager on indicators for the future. Stan Becker, a demographer with some knowledge of ecological concerns (Becker, 2013), accepted the challenge and the two worked out details for a wager on food prices for the period 2011–2020 relative to their levels for 2001–2010 (Population Assoc. of America, 2012). The FAO Food Price Index (FPI) of the five FAO food groups was used as the metric (Cluff and Mustafa, 2020).
The results are now available (FAO, 2021). Overall, the FPI for the 2011–2020 period was nineteen per cent higher than in the 2001–2010 period, with higher prices in each of the five food groups.
Obviously many factors influence food prices – the weather, trade restrictions, etc. Demographers point to the increase in population of seventy to eighty million persons per year (up to 2020 anyway) as exerting continuous pressure on food availability. Under many of the IPCC climate scenarios, food security going forward is threatened by global warming (IPCC, 2021). The overall FPI for August 2021 is higher than any yearly value since 2011 (FAO, 2021). On the other hand, food production has continued to grow faster than population in all major regions, and the FPI declined for most of the 2011–2020 decade.
In this paper we discuss our differing interpretations of these trends in food prices, explain the origins of our wager and provide our perspectives on the wager’s outcome. We also discuss the links to global population change and discuss our predictions about future food prices.
1. What was your wager about?
In 2011 David Lam gave the Presidential address at the Population Association of America Annual Meeting (Lam 2011). In it he reviewed the bet between Paul Ehrlich (biologist) and Julian Simon (economist) on whether prices of five metals would increase or decrease over the decade 1980–1990. Ehrlich bet prices would increase as supply is limited while demand is increasing with a growing world population. Simon bet the opposite and won the bet in 1990.
Lam also presented data on many indicators that have improved since 1960. He noted that the price of food, like most other commodities, had tended to decline between 1960 and 2000, but had increased significantly between 2000 and 2010. He said he expected that food prices would return to their downward trend in the future. During his address he challenged anyone in the large audience who wanted to bet him about future food prices. Stan Becker, a demographer in the audience who believes limits on food production are being reached, took up the challenge. The wager was on food prices over the decade 2011–2020 compared to food prices in the decade 2001–2010. Lam believed that food prices would go down despite continued population growth. Becker believed that resource constraints (limits on fresh water, oil and arable land) would lead to price increases. Becker’s critiques of Lam’s arguments were summarised in Becker (2013), with Lam responding in Lam (2013).
Lam and Becker agreed to use the Food and Agriculture Organization (FAO) world food price index as the source of data. FAO collects data on five food groups: meat, dairy, cereal, oil and sugar. We considered the cost of a food basket with the average prices over the decade 2011–2020 compared to those over the decade 2001–2010. For the wager, $200 was set for each food group. So if the price increased for example, by fifteen per cent for each food, then Lam would owe Becker $200*0.15*5 = $150. Similarly, if prices declined by fifteen per cent Becker would owe Lam $150. We used the real price index, which adjusts for inflation, as the basis for the wager.
2. Why was it important to you?
LAM: In making the wager I was expressing my optimism that the world would continue to experience many of the positive outcomes of the previous fifty years, as indicated by rising food production per capita, falling poverty rates and a general trend of falling prices for food and most other commodities, all in spite of the addition of four billion people between 1960 and 2011. In particular, it seemed unlikely that the sharp increase in the price of food and other commodities that was observed during the ten years before my presidential address was likely to continue. I expected that the fact that food production continued to grow faster than population would cause food prices to return to the declining trend that characterised the 1960–2000 period.
BECKER: The wager was important to me because, while Lam’s presentation of positive trends for many indicators since 1960 was correct (e.g. declining mortality and fertility, higher percentages with schooling and declining malnutrition), he minimised the looming threats and barely considered trends in ecosystem indicators. Specifically, there are major threats to the planet’s ecosystems that have come from the vast expansion of human population between 1960 (three billion) and 2010 (seven billion) and many scientists before 2011 had given quite dire forecasts for the future unless humanity acted decisively on CO2 emissions and biodiversity, to name two critical areas (e.g. Rockstrom et al. 2009; Ehrlich and Pringle, 2008). More specifically with regard to food production:
a) Virtually all the best agricultural land is already under cultivation (Frona, Szenderk and Harangi-Rakos, 2019).
b) 34 per cent of fish stocks are fished at unsustainable levels already (FAO, 2020).
c) Tropical forests are being destroyed at an alarming rate (averaging about ten million hectares per year) to make room for the production of more soy, palm oil, livestock, with the latter to feed an increasingly meat-eating world. (FAO and UNEP, 2020).
d) Drawing water from aquifers to irrigate crops in China, India, the USA and elsewhere is depleting these aquifers very rapidly (Bierkens and Wada, 2019).
e) In parallel with these problems, the diminution of natural habitats
due to the expansion of humans and crop production into virtually all areas of the globe has brought on a massive extinction of other species. For example, more than half of primate species are endangered and four of the seven large primate species are critically endangered (IUCN, 2021).
f) It is estimated that 23 per cent of total anthropogenic greenhouse gas emissions derive from agriculture, forestry and other land use (IPCC, 2019) and most of this (fifteen per cent) is from the livestock sector (Gerber et al., 2013).
3. How does the FAO collect data on food prices?
The Food Price Index is based on international agricultural commodity markets for five food groups. These include the following 23 commodities: wheat, maize, sorghum, barley and rice for the cereals group; butter, whole milk powder, skimmed milk powder and cheese for the dairy group; poultry, pig, bovine and ovine for the meat group; and sugar is the fourth group. The fifth or oils group consists of price quotations for soybean, sunflower, rapeseed, groundnut, cotton seed, copra, palm kernel, palm, linseed and castor oils (FAO, 2021).
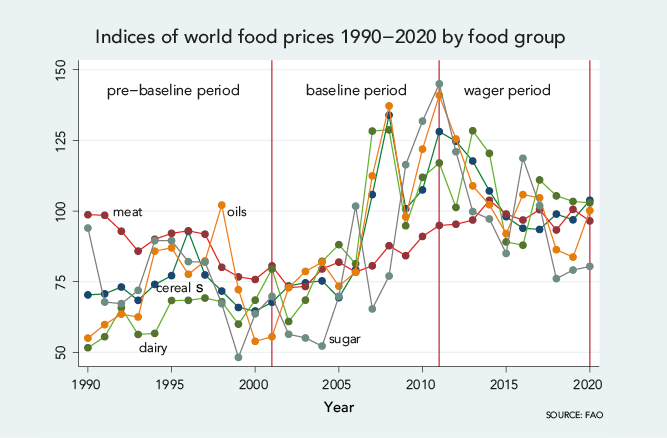
Figure 1
4. What was the outcome of the wager?
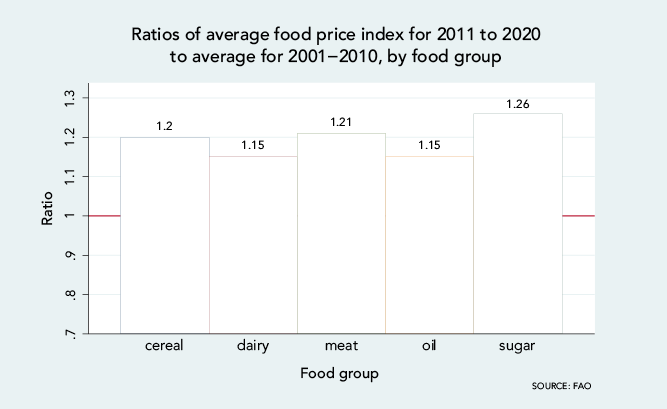
Figure 1 shows the inflation-adjusted yearly values of the food price indexes from FAO from the beginning of its series in 1990 to 2020. As seen in the figure, prices tended to decline from 1990 to 2000, rose sharply from 2000 to around 2011 (the date of Lam’s presidential address), and have tended to decline after 2011. The decline in prices after 2011 is slower than the increase from 2001–2010, however, with the result that the average prices for the 2011–2020 period are higher than the average prices for the 2001–2010 period for all five food groups. This comparison was the basis for the wager, so Becker won. Figure 2 shows the relevant ratios for the wager, by food group. Doing the mathematics reveals that Lam owes Becker $194.
Figure 2
5. How are these prices related to food production and population growth?
LAM: One fundamental fact in considering the links between food prices and population is that food production has increased faster than population in every region in the world in the past several decades. Population growth is one of the most important drivers of increased demand for food. Rising incomes and changing consumption patterns can also increase demand for food, but demand for food does not increase much from rising incomes alone. The fact that food production is growing faster than population creates downward pressure on food prices. This downward pressure can be offset by many other factors in the short run, including weather-induced crop failure on the supply side, rising incomes on the demand side, and problems in markets due to disruptions in international trade, rising transport costs, and speculative trading in commodity markets. These factors tend to create short-run volatility, but in the long run they do not offset the simple fact that food production is growing faster than population. Of course, this could all change if food production declines due to climate change or other factors, and there is good reason to worry about those problems. My prediction in 2011 was that food production would continue to grow faster than population, as it had in the previous fifty years, and that this would push food prices down. Food production did continue to grow faster than population, as I predicted, and food prices did begin to fall after 2011. Food prices tended to fall steadily from 2011 to 2020; however, prices after 2011 did not fall fast enough to go below prices for the early part of the decade 2001–2010. Because of this, the average price for 2011–2020 was higher than the average price for 2001–2010. Since these average prices for the two decades were the basis of the wager, I lost the wager.
BECKER: There is continuous pressure to increase food production in order to keep apace with population growth. Since food production per capita has actually increased, the relationship with prices is unclear. However, because meat consumption per capita has also increased, a larger portion of the cereal production is going into animal feed currently than was the case in previous decades. This does not bode well for CO2 emissions or for preservation of the global ecosystem.
6. What do you think prices will do in the future?
LAM: One thing we can be sure of is that food prices will be volatile, as they have always been, with periods of both increases and decreases due to weather shocks, fuel price volatility, international trade disruptions and speculative behaviour in futures markets. In the long run, however, I think we will not see any significant trends either up or down, a continuation of the trends of the last sixty years. The inflation-adjusted price of food in 2020 was very similar to the price in 1960, in spite of all the changes in population, technology, income, climate and other factors over that period. Agricultural production is highly responsive to prices, so increasing prices tend to be offset by rising production, while falling prices lead to decreased production. The net result is relatively stable prices in the long run, combined with lots of volatility in the short run.
BECKER: A quote from Abraham Lincoln seems appropriate here: ‘The most reliable way to predict the future is to create it.’ If population growth continues, consumption levels remain at high levels in developed countries and increasing levels in developing countries (including the trend of greater consumption of meat), and switching to renewable sources of energy only proceeds slowly, then global temperatures will continue to rise and agriculture and fisheries will be adversely affected. This would lead to food shortages and the resultant price increases in future years. Only if the global community can work together to drastically reduce emissions, change dietary habits, and reduce population growth to zero, will there be stabilisation of food prices in future years. I wonder if any economist would take a wager today about future food prices?
7. What is learned from the results of the wager and what is the take-home message for readers?
LAM: Although I clearly lost the bet, there is a sense in which we both won. Food prices have in fact declined in almost every year since my presidential address, falling from the unusually high prices that existed after the steep rise of the 2001–2010 period. On the other hand, prices have not fallen enough to go below the average prices for the 2001–2010 period, with the result that food is still more expensive now than it was in the early 2000s. Food production continues to increase faster than population in all regions of the world, including Sub-Saharan Africa, a continuing reason for optimism about the world’s ability to feed the additional billions that will be added in this century. Food prices, like all commodity prices, are quite volatile for many reasons. Short-run movements in food prices, even over several years, are not a good indicator of what is happening to overall supply and demand. In the long run we see food production more than keeping up with population growth, with food prices today being lower than they were in the 1960s, in spite of the world having almost five billion more people.
BECKER: There are many variables which affect food prices, and population growth is only one, but it does exert a steady pressure, i.e. feeding an added seventy to eighty million persons each year is a continual challenge. However, as we have seen, food prices peaked around 2010 and then declined while world population in 2020 was 838 million larger than the population in 2010 (UNDESA, 2021). Also, food prices are quite variable, which is similar to the case of the metals in the Ehrlich-Simon bet (Kiel, Matheson and Golembiewski, 2010).
If we need to continue increasing agricultural and fishery production in order to keep up with population growth, that will almost certainly mean continued deforestation, depletion of aquifers and fish catches beyond sustainable limits. Reducing population growth will ease the pressure on the already fragile ecosystems that we inhabit. More economists need to work on models which do not depend on continual growth of either population or consumption!
References
Becker, S. 2013. ‘Has the World really survived the population bomb?’ Demography 50 (6): 2173–2181. https://doi.org/10.1007/s13524-013-0236-y
M.F.P. Bierkens and Y. Wada. 2019. ‘Non-renewable groundwater use and groundwater depletion: a review’. Environmental Research Letters 14 (6): 1–43. https://doi.org/10.1088/1748-9326/ab1a5f
Cluff, M. and S. Mustafa. 2020. Food Outlook: Revisions to the FAO Food Price Indices. Rome: Food and Agriculture Organization. http://www.fao.org/3/ca9509en/ca9509en.pdf#page=78 (accessed 27 September 2021).
Ehrlich, P.R. and R.M. Pringle. 2008. ‘Where does biodiversity go from here? A grim business-as-usual forecast and a hopeful portfolio of partial solutions’. Proceedings of the National Academy of Sciences 105 (1): 11579–11586. https://doi.org/10.1073/pnas.0801911105
FAO. 2020. State of the World Fisheries and Aquaculture. Rome: Food and Agriculture Organization. https://www.fao.org/documents/card/en/c/ca9229en/ (accessed 26 November 2021).’
FAO, 2021. World Food Situation. Rome: Food and Agriculture Organization. http://www.fao.org/worldfoodsituation/foodpricesindex/en/ (accessed 27 September 2021).
FAO and UNEP. 2020. The State of the World’s Forests 2020. Forests, Biodiversity and People. Rome: Food and Agriculture Organization and United Nations Environment Programme https://doi.org/10.4060/ca8642en
Frona, D., J. Szenderk and M. Harangi-Rákos. 2019. ‘The challenge of feeding the world’. Sustainability 11 (20) 5816: 1–18. https://doi.org/10.3390/su11205816
Gerber, P.J., H. Steinfeld, B. Henderson et al. 2013. Tackling Climate Change Through Livestock – A Global Assessment of Emissions and Mitigation Opportunities. Rome: FAO.
IPCC. 2019. Climate Change and Land: An IPCC Special Report on Climate Change, Desertification, Land Degradation, Sustainable Land Management, Food Security and Greenhouse Gas Fluxes in Terrestrial Ecosystems. Geneva: The Intergovernmental Panel on Climate Change. https://www.ipcc.ch/srccl/ (accessed 27 September 2021).
IPCC. 2021. Sixth Assessment Report of the Intergovernmental Panel on Climate Change. Geneva: The Intergovernmental Panel on Climate Change. https://www.ipcc.ch/report/ar6/wg1/#SPM (accessed 27 September 2021).
IUCN 2021. IUCN Red List of Threatened Species. Gland: International Union for Conservation of Nature https://www.iucnredlist.org/search?taxonomies=100091
&searchType=species (accessed 27 September 2021).
Kiel, K., V. Matheson and K. Golembiewski. 2010. ‘Luck or skill? An examination of the Ehrlich-Simon bet’. Ecological Economics 69 (7): 1365–1367. https://doi.org/10.1016/j.ecolecon.2010.03.007
Lam, D. 2011. ‘How the world survived the population bomb: lessons from 50 years of extraordinary demographic history’. Demography 48 (4): 1231-1262. https://doi.org/10.1007/s13524-011-0070-z
Lam, D. 2013. Reply to Stan Becker, ‘Has the world really survived the population bomb? (commentary on “How the world survived the population bomb: lessons from 50 years of extraordinary demographic history”)’. Demography 50 (6): 2183–2186. https://doi.org/10.1007/s13524-013-0249-6
Population Assoc. of America. 2012. ‘The wager: Becker v. Lam on food prices’. PAA Affairs. Winter 2011–2012: 12.
Rockstrom, J., W. Steffen, K. Noone et al. 2009. ‘A safe operating space for humanity’. Nature 461: 472–475. https://doi.org/10.1038/461472a
UNDESA. 2021. World Population Prospects 2019. New York: United Nations Department for Economic and Social Affairs. Available at: https://population.un.org/wpp/DataQuery/